Download
1 / 34
340 likes | 362 Views
Project Quality Management Part One. Learning Objectives. Understand the importance of project quality management for information technology products and services Define project quality management and understand how quality relates to various aspects of information technology projects

E N D
Learning Objectives • Understand the importance of project quality management for information technology products and services • Define project quality management and understand how quality relates to various aspects of information technology projects • Describe quality planning and its relationship to project scope management • Discuss the importance of quality assurance • Explain the main outputs of the quality control process
Learning Objectives (continued) • Understand the tools and techniques for quality control, such as the Seven Basic Tools of Quality, statistical sampling, Six Sigma, and testing • Summarize the contributions of noteworthy quality experts to modern quality management • Describe how leadership, the cost of quality, organizational influences, expectations, cultural differences, and maturity models relate to improving quality in information technology projects • Discuss how software can assist in project quality management
The Importance of Project Quality Management • Bill Gates once said: “If General Motors had kept up with technology like the computer industry has, we would all be driving $25 cars that got 1,000 miles to the gallon” • In response GM issued a press release saying, if GM used technology like Microsoft did, cars would have characteristics like • For no reason whatsoever your car would crash twice a day • Every time they repainted the lines on the road, you would have to buy a new car • The airbag system would say ‘Are you sure?’ before going off. • Every time a new car model was introduced, buyers would have to learn how to drive all over again
Impact of Quality • Most people simply accept poor quality from many IT products • What if your computer crashes a couple of times a month, just make sure the data is backed up • What if you can’t access the corporate internet or intranet right now? Try a little later when it is less busy. • Is quality a real problem with respect to IT projects? • Yes it is!......Consider following examples
What Went Wrong? • In 1986, two hospital patients died after receiving fatal doses of radiation from a Therac 25 machine after a software problem caused the machine to ignore calibration data • In one of the biggest software errors in banking history, Chemical Bank mistakenly deducted about $15 million from more than 100,000 customer accounts one evening. • In August 2008, the Privacy Rights Clearinghouse stated that more than 236 million data records of U.S. residents have been exposed due to security breaches since January 2005
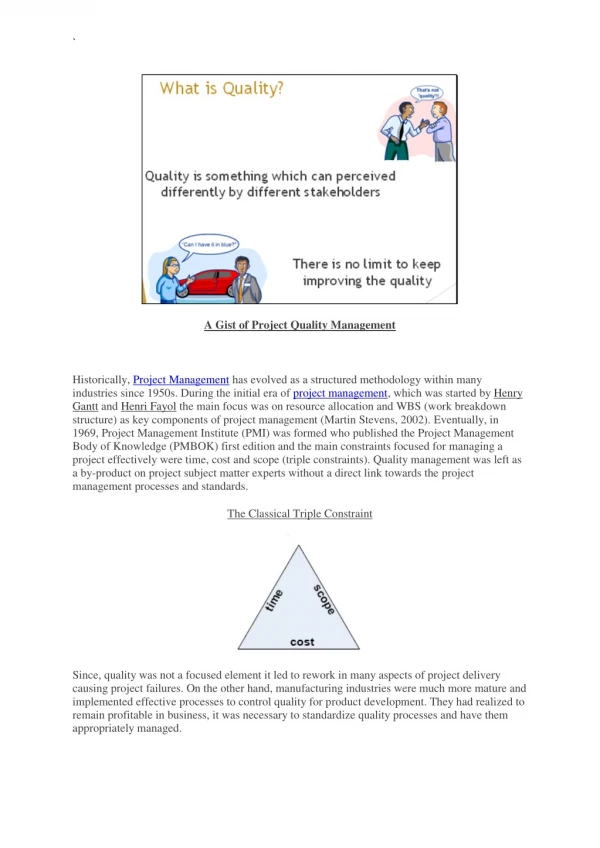
What Is Project Quality? • The International Organization for Standardization (ISO) defines quality as “the degree to which a set of inherent characteristics fulfils requirements” (ISO9000:2000) • Other experts define quality based on: • Conformance to requirements: the project’s processes and products meet written specifications • Fitness for use: a product can be used as it was intended
What Is Project Quality Management? • Project quality management ensures that the project will satisfy the needs for which it was undertaken • After all the customer ultimately decides if quality is acceptable • Many technical projects fail because the project team focuses only on meeting the written requirements • Quality, therefore, must be on an equal level with project scope, time and cost. • If the stakeholders are not satisfied with the quality of the project management or the resulting products, the project team would need to adjust scope, time and cost to satisfy them.
Project Quality Management Processes • Planning quality: identifying which quality standards are relevant to the project and how to satisfy them; a metric is a standard of measurement • Performing quality assurance: periodically evaluating overall project performance to ensure the project will satisfy the relevant quality standards • Performing quality control: monitoring specific project results to ensure that they comply with the relevant quality standards
Planning Quality • Implies the ability to anticipate situations and prepare actions to bring about the desired outcome • In other words preventing defects from happening • Important to prevent defects by: • Selecting proper materials • Training and indoctrinating people in quality • Planning a process that ensures the appropriate outcome • In project quality planning it is important to identify relevant quality standards, such as ISO standards and design quality into the products and processes of a project
Design of Experiments • Design of experiments is a quality planning technique that helps identify which variables have the most influence on the overall outcome of a process • Example of circuit design variables • Also applies to project management issues, such as cost and schedule trade-offs • Example of Junior and Senior programmers • Involves documenting important factors that directly contribute to meeting customer requirements
Scope Aspects of IT Projects • It is often difficult to understand the performance dimension of IT projects as customers often find it difficult to explain what they want. • Important scope aspects that affect quality are • Functionality is the degree to which a system performs its intended function. • Features are the system’s special characteristics that appeal to users • System outputs are the screens and reports the system generates • It is important to clarify what functions and features the system must perform, and what functions and features are optional.
Scope Aspects of IT Projects • Performance addresses how well a product or service performs the customer’s intended use e.g. How fast must the response time be under different condition. • Reliability is the ability of a product or service to perform as expected under normal conditions. Most IT projects cannot achieve 100% reliability but stakeholders must define what their expectations are. • Maintainability addresses the ease of performing maintenance on a product • These aspects of project scope are just a few of the requirement issues related to quality planning. • It is important for project team and stakeholders to realize their role in defining the most critical quality needs and also communicate these needs across the board.
Who’s Responsible for the Quality of Projects? • Project managers are ultimately responsible for quality management on their projects • Project Managers should be familiar with basic quality terms, standards and resources • Several organizations and references can help project managers and their teams understand quality • International Organization for Standardization (www.iso.org) • IEEE (www.ieee.org)
Performing Quality Assurance • Quality assurance includes all the activities related to satisfying the relevant quality standards for a project • Another goal of quality assurance is continuous quality improvement • Several tools and techniques used in quality planning can also be used in quality assurance like Design of experiments. • Benchmarking generates ideas for quality improvements by comparing specific project practices or product characteristics to those of other projects or products within or outside the performing organization • A quality audit is a structured review of specific quality management activities that help identify lessons learned that could improve performance on current or future projects • Industrial engineers can help perform quality audits by specifying different metrics and evaluating them throughout the project.
Quality Control • Monitor specific project results to determine its compliance with the Quality Standards • Identify ways to eliminate causes of unsatisfactory results • Continuous Process • The main outputs of quality control are: • Acceptance decisions – determine whether the products or services produced will be accepted or not • Rework – is action taken to bring rejected items into compliance with product requirements. • Process adjustments – correct or prevent further quality problems based on quality control measurements. • There are Seven Basic Tools of Quality that help in performing quality control
Cause-and-Effect Diagrams • Cause-and-effect diagrams trace complaints about quality problems back to the responsible production operations • They help you find the root cause of a problem • Also known as fishbone or Ishikawa diagrams • Can also use the 5 whys technique where you repeatedly ask the question “Why” (five is a good rule of thumb) to peel away the layers of symptoms that can lead to the root cause
Quality Control Charts • A control chart is a graphic display of data that illustrates the results of a process over time • The main use of control charts is to prevent defects, rather than to detect or reject them • Quality control charts allow you to determine whether a process is in control or out of control • When a process is in control, any variations in the results of the process are created by random events; processes that are in control do not need to be adjusted • When a process is out of control, variations in the results of the process are caused by non-random events; you need to identify the causes of those non-random events and adjust the process to correct or eliminate them
The Seven Run Rule • You can use quality control charts and the seven run rule to look for patterns in data • The seven run rule states that if seven data points in a row are all below the mean, above the mean, or are all increasing or decreasing, then the process needs to be examined for non-random problems
Run Chart • A run chart displays the history and pattern of variation of a process over time • It is a line chart that shows data points plotted in the order in which they occur • Can be used to perform trend analysis to forecast future outcomes based on historical patterns
Scatter Diagram • A scatter diagram helps to show if there is a relationship between two variables • To identify the correlations that might exist between a quality characteristic and a factor that might be driving it • The closer data points are to a diagonal line, the more closely the two variables are related • By knowing which elements of your process are related and how they are related, you will know what to control or what to vary to affect a quality characteristic
Histograms • A histogram is a bar graph of a distribution of variables • To determine the spread or variation of a set of data points in a graphical form • Each bar represents an attribute or characteristic of a problem or situation, and the height of the bar represents its frequency • Allows you to understand at a glance the variation that exists in a process • Not only can histograms help you know which processes need improvement they can also help you track that improvement
Pareto Charts • A Pareto chart is a histogram that can help you identify and prioritize problem areas • Pareto analysis isalso called the 80-20 rule, meaning that 80 percent of problems are often due to 20 percent of the causes • You measure the percentage of complaints and focus on the area which addresses the highest no of occurring complaints • Weighted Pareto charts use the quantity of defects multiplied by their cost to determine the order
Flowcharts • Flowcharts are graphic displays of the logic and flow of processes that help you analyze how problems occur and how processes can be improved • They show activities, decision points, and the order of how information is processed • Potential weakness in the process are made visual • Picture of process as it should be • Shows duplicated effort and other non-value-added steps • Clarify working relationships between people and organizations • Target specific steps in the process for improvement
Statistical Sampling • Statistical sampling involves choosing part of a population of interest for inspection • It is a key concept in project quality management • The size of a sample depends on how representative you want the sample to be • Sample size formula: Sample size = .25 X (certainty factor/acceptable error)2 • Be sure to consult with an expert when using statistical analysis
Commonly Used Certainty Factors Suppose we have a system to process invoices from all the suppliers. From historic data we know that there were 50,000 invoices last year. Now we need to determine how many invoices must be examined in order to determine the type of data the system would need to capture. We could use the certainty factor of 90 percent Sample size = 68 Invoices should be examined