Download
1 / 23
230 likes | 351 Views
Modeling Overview IWMM technical team July 28, 2011. SHC Process at Several Linked Scales. 5-10 year process. Regional (administrative) scale: Linking prioritization and management. Annual process. Regional / Flyway Objectives. Model. Regional / Flyway. Uncertainty. Regional

E N D
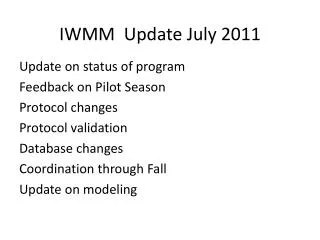
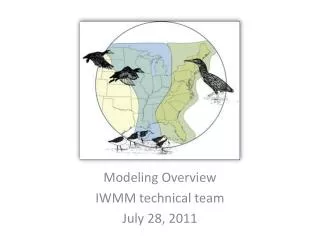
Modeling Overview IWMM technical team July 28, 2011
5-10 year process Regional (administrative) scale: Linking prioritization and management Annual process
Regional / Flyway Objectives Model Regional / Flyway Uncertainty Regional Actions Local Mgmt Objectives Model Uncertainty Local Mgmt Local Actions Predict Observe
Flyway to Region • How is the flyway model used to inform regional guidance to local scale? • Flyway Model analysis provides prioritization: • Relative Contribution of locale to flyway “fitness” for each guild • Answers: How important is habitat quality at a specific location for the entire migratory path?
Region to Local • How does Region use flyway model output to guide local management decisions? • Regional Allocation routine answers: • What guild(s) should refuge be managing for given the landscape and location in the migratory flyway?
Local Scale • How does local scale incorporate regional output to make efficient decisions? • Local SDM routine determines: • Optimal management action chosen from a discrete menu to maximize objective function given expected habitat response to each action
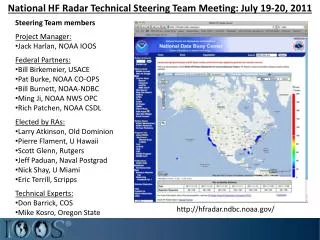
IWMM Process Flowchart GIS Analysis Flyway Model Monitoring Data Local Scale Model Regional Allocation Model
Chronic Disturbance Forage Roosting Node Quality GIS Analysis • Create three layers at finest res (e.g. 30 meter) • Roosting habitat layer • Forage quality layer • Disturbance layer • Layers are integrated to create a summary at node scale (e.g. 20 mile)
Integrate GIS layers Atlantic Flyway – 30m Atlantic Flyway - Node
Flyway Model • Inputs • GIS maps of available kcals, disturbance, daily gain • Bird energetic parameters (flight cost, flight speed,…) • Wintering and breeding sites to determine where birds “start” and “end”
Regional Model • Prioritization • Which guilds should each area (e.g. refuge) manage for? • By guild, what locations are most important? • What changes can be expected? • Protection • Acquisition • Habitat loss?
Linking Flyway to Regional Allocation Determining management contribution • Virtually improve habitat quality (e.g. add kilocalories) at each site • Re-run flyway model • Compare overall flyway fitness before and after management • Identify sites with biggest gains • Repeat with other guilds Refuge Nodes Management Effort
Determining management contribution • Virtually improve habitat quality (e.g. add kilocalories) at each site • Re-run flyway model • Compare overall flyway fitness before and after management • Identify sites with biggest gains • Repeat with other guilds
Regional Allocation Model • This information is passed to local scale model • G1 means guild 1 (e.g. dabblers)
Objectives for Alligator River and Mattamuskeet NWR complexes • Flyway and Regional models provide refuge specific guidance on objectives that take into flyway dynamics • These objectives inform local decisions
Local Structured Decision Making • More straightforward and is similar to many other local SDMs out there • Time scale: annual • State-and-transition model based on veg monitoring metrics • Other data correlated? • Objectives are received from region • what guilds are important
Next Steps • Continue work to link models to monitoring data • Models are likely to be tweaked as protocols change • Sensitivity analysis • Include additional guilds (shorebirds) • Work with decision-makers at: • Regional Scale (region, JVs, states) • Local Scale (refuge managers, etc)