Download
1 / 106
1.13k likes | 1.43k Views
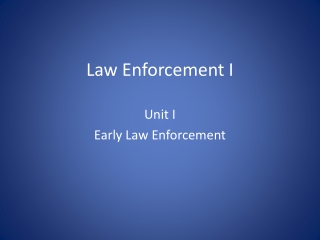
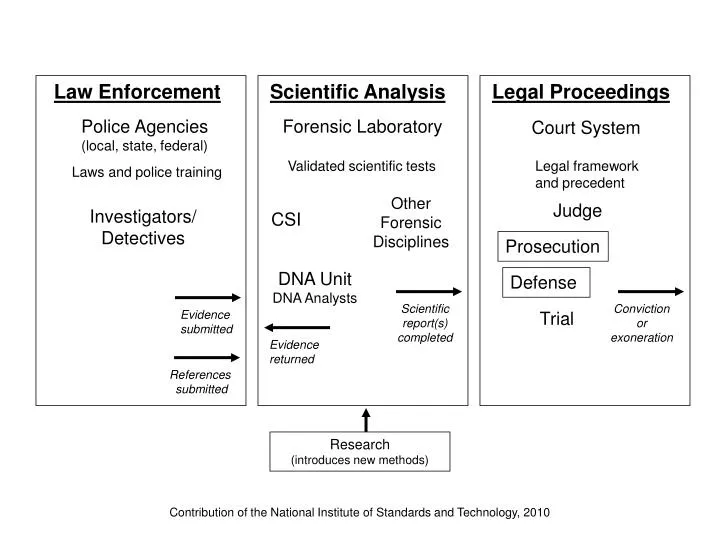
Law Enforcement. Scientific Analysis. Legal Proceedings. Police Agencies (local, state, federal). Forensic Laboratory. Court System. Validated scientific tests. Legal framework and precedent. Laws and police training. Other Forensic Disciplines. Judge. Investigators/ Detectives.

E N D
Law Enforcement Scientific Analysis Legal Proceedings Police Agencies (local, state, federal) Forensic Laboratory Court System Validated scientific tests Legal framework and precedent Laws and police training Other Forensic Disciplines Judge Investigators/ Detectives CSI Prosecution DNA Unit DNA Analysts Defense Scientific report(s) completed Conviction or exoneration Evidence submitted Trial Evidence returned References submitted Research (introduces new methods) Contribution of the National Institute of Standards and Technology, 2010
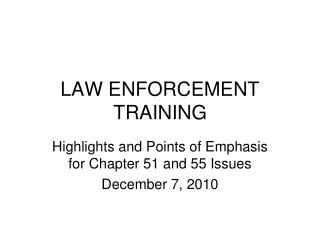
Sample Obtained from Crime Scene or Paternity Investigation Biology DNA Quantitation PCR Amplification of Multiple STR markers DNA Extraction Technology Separation and Detection of PCR Products (STR Alleles) Sample Genotype Determination Genetics Generation of Case Report with Probability of Random Match Comparison of Sample Genotype to Other Sample Results If match occurs, comparison of DNA profile to population databases Contribution of the National Institute of Standards and Technology, 2010
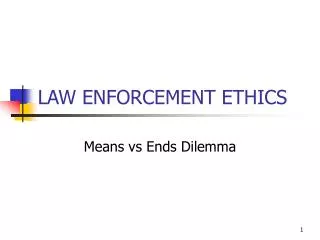
Steps Involved Collection Q U A L I T Y A S S U R A N C E Sample Storage Serology Characterization Extraction Quantitation Biology Amplification STR Markers Separation/ Detection Technology Data Interpretation Statistical Interpretation Genetics Crime committed Suspect developed Biological material transferred May match another (K’) May match another (K’) Reference (Known) sample “K” Evidence (Question) sample “Q” Database Search Steps Involved Collection Q U A L I T Y A S S U R A N C E Exclusion (no match) Sample Storage Q ≠ K Extraction Q K DNA Profile Comparison Quantitation Amplification Q = K STR Markers Inclusion (match) Separation/ Detection Report (with statistical weight) Data Interpretation Court Plea Contribution of the National Institute of Standards and Technology, 2010 Profile put on database Profile put on database
(a) (b) • 5’end • | • Phosphate • | • Sugar—Base… • | • Phosphate • | • Sugar—Base… • | • 3’end 5’ 3’ Contribution of the National Institute of Standards and Technology, 2010
Hydrogen bonds 5’ 3’ 5’ A = T 3’ A = T G C hybridized strands G C A = T T = A Phosphate-sugar backbone T = A C G C G A = T A T T = A A T G C C G C G G C denatured strands C G 5’ 3’ G C 3’ 5’ Contribution of the National Institute of Standards and Technology, 2010
Nuclear DNA - Located in cell nucleus Autosomes Located in mitochondria (multiple copies in cell cytoplasm) 2 copies per cell mtDNA 16,569 bp Only single copy of each autosome shown http://www.ncbi.nlm.nih.gov/genome/guide/ 1 2 3 4 5 6 7 8 9 10 11 12 mtDNA 13 14 15 16 17 18 19 20 21 22 X Y 100s of copies per cell Sex-chromosomes 3.2 billion bp The Human Genome Contribution of the National Institute of Standards and Technology, 2010
Chromosome 12 telomere p (short arm) 12p3 Band 3 centromere q (long arm) 12q5 Band 5 telomere Contribution of the National Institute of Standards and Technology, 2010
(A) Sequence polymorphism --------AGACTAGACATT------- --------AGATTAGGCATT------- (B) Length polymorphism ---------(AATG)(AATG)(AATG)---------- 3 repeats ---------(AATG)(AATG)---------- 2 repeats Contribution of the National Institute of Standards and Technology, 2010
Locus A Homologous pair of chromosomes Allele 1 Allele 2 4 5 Allele 2 Allele 1 3 6 Homologous pair of chromosomes Locus B Contribution of the National Institute of Standards and Technology, 2010
X X X 1 1 1 2 2 2 3 3 3 4 4 4 5 5 5 6 6 6 7 7 7 8 8 8 9 9 9 10 10 10 11 11 11 12 12 12 13 13 13 14 14 14 15 15 15 16 16 16 17 17 17 18 18 18 19 19 19 20 20 20 21 21 21 22 22 22 Y Y Maternal Contribution Sex chromosome Egg (haploid) mtDNA Paternal Contribution Sex chromosome Sperm (haploid) or Nuclear DNA Sex chromosomes Mitochondrial DNA Autosomes Zygote (diploid) Male Child’s Full Genome mtDNA Contribution of the National Institute of Standards and Technology, 2010
Resulting genotype combinations and frequencies AA p2 Aa 2pq aa q2 Mother gametes (egg) A a q p AA aA A qp p2 p Father gametes (sperm) a Aa aa q pq q2 Punnett square Freq (A) = p p + q = 1 (p + q)2 = p2 + 2pq + q2 Freq (a) = q Contribution of the National Institute of Standards and Technology, 2010
Frequency of A allele (p) 1.0 0.8 0.6 0.4 0.2 0.0 AA aa p2 0.8 q2 Aa 0.6 2pq Frequency of genotype in population 0.4 0.2 0.2 0.4 0.6 0.8 0.0 1.0 Frequency of a allele (q) Contribution of the National Institute of Standards and Technology, 2010
1 2 23.2, 25 20,22 6 3 4 7 5 8 17 22, 23.2 20,25 20,22 20,25 20,22 22,22 #4 #2 Mother’s alleles 9 10 11 12 13 14 15 16 Mother’s alleles 22, 23.2 22, 23.2 22,24 22,25 20,22 20,25 20,22 22,25 20 25 23.2 25 20,20 20,25 20,23.2 20,25 20 20 #7 #1 Father’s alleles Father’s alleles #14 #4 #5 20,22 22,25 22,23.2 22,25 22 22 #12 #13 #3 (a) (c) (b) Contribution of the National Institute of Standards and Technology, 2010
Markers Used (Biology) High RFLP Multi-Locus Probes Multiplex STRs RFLP Single Locus Probes Power of Discrimination (Genetics) PolyMarker D1S80 mtDNA single STR DQ ABO blood groups Low Slow Fast Speed of Analysis (Technology) Contribution of the National Institute of Standards and Technology, 2010
Mother’s Blood Type Child’s Blood Type Father’s Blood Type Contribution of the National Institute of Standards and Technology, 2010
Single-Locus Probe Multi-Locus Probe Probe 1 Probe 2 Probe 3 Probe 33.6 D1S7 D2S44 D4S139 Contribution of the National Institute of Standards and Technology, 2010
Sizing ladder Restriction site Restriction site VNTR probe 7 repeats Large allele Small allele 13 repeats Small allele probe Large allele Bands seen on autoradiogram of probed membrane Contribution of the National Institute of Standards and Technology, 2010
TGCAGGCCTAACG ACGTCCGGATTGC TGCAG ANTCTAACG ACGTCTNA GATTGC TGCACTGCA GTAACG ACGTG ACGTCATTGC HaeIII HinfI PstI Contribution of the National Institute of Standards and Technology, 2010
CAGGTCAGC Immobilized SSO probe 5’ Nylon membrane Allele 1 Allele 2 View from above nylon membrane match no match TMB (colorless) Colored precipitate HRP Strepavidin PCR product (denatured) Biotin GTCCAGTCG 3’ hybridization Contribution of the National Institute of Standards and Technology, 2010
1.2 1.3 4 All but 1.3 AMPLITYPETM DQ-Alpha 1 2 3 4 C 1.1 1.3 1.2 1.3 4 All but 1.3 4.2 4.3 DQA1 1 2 3 4 C 1.1 1.3 4.1 LDLR GYPA HBGG D7S8 GC S A B A B A B C A B A B C (A) Control dot Subtype allele specific dots Nominal allele specific dots (B) 1.2/3 AB AB BB AB BC “S” dot Contribution of the National Institute of Standards and Technology, 2010
Allelic Ladder Allelic Ladder 41 41 Sample 1 Sample 2 Positive Control 34 34 31 31 30 30 29 29 28 28 27 27 26 26 25 25 24 24 23 23 22 22 21 21 20 20 19 19 18 18 17 17 16 16 14 14 Contribution of the National Institute of Standards and Technology, 2010
Minisatellite Marker (D1S80) Flanking regions Repeat region GAGGACCACCAGGAAG 16 bp repeat unit STR Marker (TH01) Flanking regions Repeat region TCAT 4 bp repeat unit Contribution of the National Institute of Standards and Technology, 2010
Allelic Ladders Allelic Ladders Sample 1 Sample 2 CSF1PO 14 6 TPOX 12 11 10 9 8 TH01 11 10 9 8 7 6 5 Contribution of the National Institute of Standards and Technology, 2010
3’-TAAATGATTCC-5’ DNA template 5’ 3’ A Primer anneals AT Extension produces a series of ddNTP terminated products each one base different in length ATT ATTT ATTTA ATTTAC Each ddNTP is labeled with a different color fluorescent dye ATTTACT ATTTACTA ATTTACTAA ATTTACTAAG ATTTACTAAGG Sequence is read by noting peak color in electropherogram (possessing single base resolution) Contribution of the National Institute of Standards and Technology, 2010
Contribution of the National Institute of Standards and Technology, 2010
Contribution of the National Institute of Standards and Technology, 2010
Contribution of the National Institute of Standards and Technology, 2010
FTA Paper ORGANIC CHELEX SDS, DTT, EDTA and proteinase K Apply blood to paper and allow stain to dry Blood stain Blood stain Water INCUBATE (56 oC) PUNCH INCUBATE (ambient) Phenol, chloroform, isoamyl alcohol REMOVE supernatant VORTEX WASH Multiple Times with extraction buffer TRANSFER aqueous (upper) phase to new tube REMOVE supernatant INCUBATE (56 oC) TE buffer INCUBATE (100 oC) CONCENTRATE sample (Centricon/Microcon-100 or ethanol precipitation) (NO DNA QUANTITATION TYPICALLY PERFORMED WITH UNIFORM SAMPLES) QUANTITATE DNA PERFORM PCR PERFORM PCR QUANTITATE DNA PERFORM PCR Centrifuge Centrifuge Centrifuge Centrifuge Centrifuge 5% Chelex PCR Reagents Contribution of the National Institute of Standards and Technology, 2010
Centrifuge Remove a portion of the mixed stain Differential Extraction SDS, EDTA and proteinase K (cell lysis buffer) Incubate at 37 oC Perpetrator’s sperm mixed with victim’s epithelial cells sperm pellet REMOVE supernatant SDS, EDTA and proteinase K + DTT DTT lyses sperm heads “Male Fraction” “Female Fraction” sperm pellet Contribution of the National Institute of Standards and Technology, 2010
(c) (b) Within optimal range Too little DNA amplified (a) Too much DNA amplified Contribution of the National Institute of Standards and Technology, 2010
Unknown Samples Calibration standards Calibration standards ≈2.5 ng 20 ng 0.63 ng 10 ng 1.25 ng 2.5 ng 5 ng 5 ng 2.5 ng 10 ng 1.25 ng 20 ng 0.63 ng Contribution of the National Institute of Standards and Technology, 2010
R Forward primer Q 5’ 5’ 3’ 3’ 5’ 3’ 5’ 5’ Reverse primer Forward primer Q R R 3’ 5’ 3’ 5’ 3’ 5’ 5’ Reverse primer Q Forward primer 5’ 3’ 5’ 3’ 5’ 5’ Reverse primer TaqMan probe Polymerization and Strand Displacement Probe Cleavage (release of reporter dye) Fluorescence occurs when reporter dye and quencher dye are no longer in close proximity Completion of Polymerization Contribution of the National Institute of Standards and Technology, 2010
Contribution of the National Institute of Standards and Technology, 2010
Plateau Linear product growth ΔRn Normalized Fluorescence Exponential product growth threshold Negative control Standard curve c d a b e CT Cycle Number e d c CT b a Log[DNA] Nc = No (1 + E)c If efficiency is close to 100% (E = 1), then the product copy number (Nc) doubles the target copy number (No) with each cycle (c). Contribution of the National Institute of Standards and Technology, 2010
94 oC 94 oC 94 oC 94 oC 72 oC 72 oC 72 oC Temperature 60 oC 60 oC 60 oC Single Cycle Time Typically 25-35 cycles performed during PCR The denaturation time in the first cycle is lengthened to ~10 minutes when using AmpliTaq Gold to perform a “hot-start” PCR Contribution of the National Institute of Standards and Technology, 2010
5’ 3’ Starting DNA Template 3’ 5’ Separate strands (denature) Forward primer 5’ 3’ 3’ 5’ Add primers (anneal) 5’ 3’ 5’ 3’ Reverse primer Make copies (extend primers) Repeat Cycle, Copying DNA Exponentially Contribution of the National Institute of Standards and Technology, 2010
Contribution of the National Institute of Standards and Technology, 2010
(a) (b) Contribution of the National Institute of Standards and Technology, 2010
Locus C Locus A Locus B A B C small large (a) Simultaneous amplification of three locations on a DNA template (b) Resolution of PCR products with size-based separation method Contribution of the National Institute of Standards and Technology, 2010
(a) PCR product size generated Fluorescent dye DNA template containing STR marker Forward PCR primer Reverse PCR primer GATA GATA GATA GATA Flanking regions STR repeat region (b) 4 repeat units 5 repeat units 6 repeat units Contribution of the National Institute of Standards and Technology, 2010
1 2 3 4 5 6 5’-TTTCCC TCAT TCAT TCAT TCAT TCAT TCAT TCACCATGGA-3’ 3’-AAAGGG AGTA AGTA AGTA AGTA AGTA AGTA AGTGGTACCT-5’ 6 5 4 3 2 1 Contribution of the National Institute of Standards and Technology, 2010
Individual Samples 8 6 9 7 8 Combine and re-amplify 9 10 6 7 8 9 10 Allelic Ladder Contribution of the National Institute of Standards and Technology, 2010
AmpFlSTR Identifiler kit (Applied Biosystems) 6-FAM (Blue) D8S1179 D7S820 CSF1PO D21S11 VIC (Green) D3S1358 TH01 D13S317 D16S539 D2S1338 TPOX D19S433 VWA D18S51 NED (Yellow) AMEL D5S818 FGA PET (Red) LIZ (Orange) GS500 LIZ size standard PowerPlex 16 kit (Promega Corporation) FL (Blue) TH01 D3S1358 D21S11 D18S51 Penta E JOE (Green) Penta D D5S818 D13S317 D7S820 D16S539 CSF1PO TMR (Yellow) TPOX AMEL VWA D8S1179 FGA CXR (Red) ILS600 CXR size standard PCR product size (bp) Contribution of the National Institute of Standards and Technology, 2010
Overlay of all 4 colors (including internal size standard) blue panel Penta E D18S51 TH01 D21S11 D3S1358 D5S818 green panel D7S820 CSF1PO Penta D D13S317 D16S539 yellow panel VWA D8S1179 Amelogenin (sex-typing) FGA TPOX red panel ILS600 DNA sizing standard 200 bp 400 bp 500 bp 100 bp 300 bp 325 350 375 425 450 475 225 250 275 120 140 160 180 Contribution of the National Institute of Standards and Technology, 2010
D7S820 (10 alleles) CSF1PO (10 alleles) Blue panel D8S1179 (12 alleles) D21S11 (24 alleles) TH01 (10 alleles) D13S317 (8 alleles) D16S539 (9 alleles) Green panel D2S1338 (14 alleles) D3S1358 (8 alleles) VWA (14 alleles) TPOX (8 alleles) Yellow panel D19S433 (15 alleles) D18S51 (23 alleles) Red panel FGA low (19 alleles) AMEL (2 alleles) D5S818 (10 alleles) FGA high (9 alleles) LIZ-labeled GS500 DNA sizing standard 150 bp Orange panel 300 bp 200 bp 250 bp* 340 bp 139bp 350 bp 100 bp 160 bp Contribution of the National Institute of Standards and Technology, 2010
Fluorescent dye at 5’end For each linker unit added, there is an apparent migration shift of ≈2.5 bp Primer sequence 3’-end 5’-end Non-nucleotide linkers (mobility modifiers) PCR amplification generates a labeled PCR product containing the mobility modifiers Contribution of the National Institute of Standards and Technology, 2010
Size overlap (a) COfiler kit allele relative size ranges 6 15 CSF1PO JOE-labeled (green) 279.65 bp 317.67 bp 6 15 D7S820 NED-labeled (yellow) 256.01 bp 292.62 bp (b) Identifiler kit allele relative size ranges 10 non-nucleotide linkers = ≈ +25 bp shift 6 15 6 15 D7S820 CSF1PO 6FAM-labeled (blue) 6FAM-labeled (blue) 255.15 bp 291.58 bp 304.69 bp 341.84 bp Contribution of the National Institute of Standards and Technology, 2010
(a) PowerPlex 1.1 Kit CSF1PO forward primer (AGAT)6-15 TMR-labeled (AGAT)6-15 91 bp 128 bp CSF1PO reverse primer PCR product sizes = 291-327 bp (b) PowerPlex 16 Kit CSF1PO forward primer 13 bp 238 bp JOE-labeled CSF1PO reverse primer PCR product sizes = 221-357 bp +30 bp shift in size Contribution of the National Institute of Standards and Technology, 2010
6 bp deletion X Y AmpFlSTR kits and PowerPlex 16 PowerPlex 1.1 X = 212 bp Y = 218 bp X = 106 bp Y = 112 bp Female: X, X 1:1 Mixture: 3X + 1Y Male: X, Y Contribution of the National Institute of Standards and Technology, 2010
Contribution of the National Institute of Standards and Technology, 2010