CS 402: Scientific Visualization with MATLAB
270 likes | 441 Views
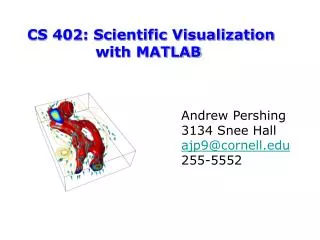
CS 402: Scientific Visualization with MATLAB. Andrew Pershing 3134 Snee Hall ajp9@cornell.edu 255-5552. Outline. Course Description Details Policies Intro to CIS Tools Curriculum Role of Visualization in Science and Engineering Basic Concepts. Course Goals.

CS 402: Scientific Visualization with MATLAB
E N D
Presentation Transcript
CS 402: Scientific Visualization with MATLAB Andrew Pershing 3134 Snee Hall ajp9@cornell.edu 255-5552
Outline Course Description Details Policies Intro to CIS Tools Curriculum Role of Visualization in Science and Engineering Basic Concepts
Course Goals This course will: Teach you how to visualize data in Matlab Explore the paradigms and algorithms underlying Matlab’s graphics system Identify interesting concepts and useful techniques in scientific visualization By the end of the course, you should have the skills necessary to create and customize visualizations of your data
Syllabus 1. Course Intro and Basic Concepts 2. Intro to Handle Graphics and 1D primitives 3. Figures and Axes, Printing and Saving 4. More about plot, specialized 1D functions 5. 2D routines in 2D: properties and options 6. 2D routines in 3D: surfaces 7. Adding a dimension with color 8. More color 9. Lighting 10. 3D routines: isosurfaces, slices 11. GUI’s: uicontrols and callbacks 12. Loose ends and where to go from here
Course Ungoals This course will NOT: Get you a job with Pixar (try CS417) Will talk a little about computer graphics, but focus will be on producing images of scientific data Teach you Matlab programming (try CS 401) You should be comfortable writing programs in Matlab Read through Hanselman & Littlefield or Matlab help documentation for more info Cover all MATLAB graphics routines
http://www.cs.cornell.edu/Courses/cs402/2002fa Contains syllabus, lecture notes, examples, homework Office Hours Tuesday & Wednesday 1-2 in 3134 Snee (or by appointment) Registration: get my signature or CS Undergrad office (303 Upson) S/U only, 1 credit Last day to add/drop: Monday, October 7 ! Course Business:
Requirements Reference Text: Hanselman and Littlefield Mastering Matlab 6 No required reading, but this is a great reference Find a computer with MATLAB (v6 preferred, but v5 is OK): Check departmental labs--good site licensing for Cornell machines ACCEL in Carpenter Hall Upson, Carpenter, and Dickson Labs Buy student version or license from CIT ($50): http://www.cit.cornell.edu/computer/news/briefs.html#matlab
4 assignments: 1 per week, due Wednesday, 5PM by e-mail If you complete each assignment on time and demonstrate a basic command of the material, you will pass! Course policies are strict: A direct consequence of the “mini-course” format This course operates as a contract between you and me Course Policies
I agree to: Begin and end lecture on time Put lecture notes on website prior to lecture Be available during office hours Make the assignments of reasonable length (2-4 hours) focusing on material from lectures The Contract
By registering for the course, you agree to: Arrive on time Participate in the course by asking questions and coming to office hours Turn in your assignments on time Late work will not be accepted and will jeopardize your chance of passing! The only exceptions are for documented, university-sanctioned reasons such as severe illness or by prior arrangement made w/ me 3 days before (includes religious holidays, sports, etc.) The Contract
Cornell University has recognized that computing and information science has emerged as a key enabling discipline vital to nearly all of its scholarly and scientific pursuits. The Faculty of Computing and Information is founded on the recognition that the ideas and technology of computing and information science are relevant to every academic discipline. We are united in the need to bring together a core of faculty in this field from across the traditional colleges. CIS and FCI
CS 402 (should be CIS 402) is the second in a series of courses designed to teachapplied scientific computing CIS Tools Curriculum Science & Engineering CS applied pure Scientific computing
CIS Tools Curriculum “Pure” Scientific Computing Focus is on algorithms for general problems such as optimization, linear systems, differential equations Concerned with accuracy, stability, and efficiency of these algorithms “Applied” Scientific Computing How to apply general algorithms to solve scientific problems Algorithms are “black boxes” that we string together to get our work done
CIS Tools Curriculum Fall: MATLAB 401: the basics 402: visualization Spring: General tools 403: Developing scientific computer programs (compilers, debuggers, managing large projects) 404: Numerical libraries
Role of Visualization in Science and Engineering A significant amount of a scientist’s time is spent creating visual representations of scientific data or ideas We want to understand why visualization is important? what is required to make an effective visualization? how to do this on a computer (in Matlab)?
A Brief History of Visualization Primates are visual animals consequence of evolving in a complicated 3D environment (trees) our sense of smell is bad (fresh vs. sour milk, but not one person from another)
A Brief History of Visualization Humans have been creating artificial representations of reality (pictures) for thousands of years cave paintings maps diagrams Pictographic languages were replaced by alphabets (a few small pieces put together in many combinations vs. a new piece for each word) But, graphics are still important (a picture is worth 1,000 words)
A Brief History of Visualization Visualization has played a critical role in science • -Ancient geometers invented special tools for drawing accurate shapes • maps of geologic data suggested S. America and Africa were connected • Pauling built models of alpha-helix, Watson & Crick DNA • photography
Computer Graphics Revolution Intel brags about GHz, IBM brags about flops, but Graphics have made the computer industry computer sales exploded with MacOS and Windows GUIs proof that we are a visual rather than command-line species industry now driven by web and games Scientists have directly benefited from these developments computers and graphics software are faster, cheaper, and easier to use quality of output (electronic and print) is better
Scientific Visualization Humans are visual species, so creating a graphical representation of your result or ideas will make them easier to communicate What do we mean by visualization? graphical rather than pure text should think of visualization as a model that may make assumptions literal vs. figurative
Figurative Visualizations Science & Engineering CS pure applied Scientific computing
Literal (“Classic”) Visualizations Relationship, Lag=3 1 Calanus 0 1998 -1 -6 -4 -2 0 2 4 RSW Temp. Index
Goals: communicate results--create an image that viewer will remember represent results--accurate representation allows others to extrapolate from your data attract attention--get people to read your paper/poster (advertising) Scientific Visualization
Visualization Criteria Hard to define a good visualization, but here are some thoughts: Western languages read left-to-right, your axes should as well the exception is paleontology which has a right-left convention but, orient vertically to plot vs. depth Colors are great, but should be used carefully: avoid mixing red and green expensive to publish in color not entirely quantitative be aware of viewers common experience: red=hot, blue=cold land is green/yellow/brown, ice is white, water is blue
Why Matlab? There are lots of options for scientific graphics Low-end packages (Excel) simple, but limited can’t program High-end packages (AVS, OpenDX) great output unique inteface (“nets”) often hard to get data into, difficult to program
Numerical Computing Environments (Matlab, S+, IDL) easy to work with data lots of canned features, but can program and automate graphics output is nearly as good as high-end large user-base (CS100, other courses) Why Matlab?
for j=1:4 plot field j save to JPEG end Programmed Plots