Download
1 / 37
370 likes | 491 Views
Spatio-temporal variation in pike demography and dispersal: effects of harvest intensity and population density. Thrond O Haugen. Who’s involved?. Project leader: Nils Chr. Stenseth Centre for Ecology and Hydrology Ian Winfield Universit y of Oslo Leif Asbjørn Vøllestad

E N D
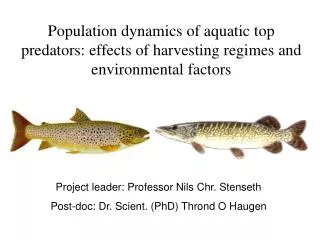
Spatio-temporal variation in pike demography and dispersal: effects of harvest intensity and population density Thrond O Haugen
Who’s involved? • Project leader: Nils Chr. Stenseth • Centre for Ecology and Hydrology • Ian Winfield • University of Oslo • Leif Asbjørn Vøllestad • Per Aass (Zoologisk museum) • Management • Tore Qvenild (Hedmark) • Ola Hegge (Oppland) • NIVA • Gösta Kjellberg
Size-biased harvest of fish • Ecological implications • Affects demography directly • Effects on population dynamics • Affects population density that in turn will affect growth conditions • Evolutionary implications • Life-history adaptations to man-made mortality regime and growth conditions
General project objectives • In order to gain better knowledge of pike population dynamics: • Estimate demographic rates under changing harvesting regimes • Quantify natural- and fishing mortality • Estimate recruitment to fisheries • Estimate dispersal under varying population densities
Data background • Tagged during spring • Three methods • Pike gill nets (64 mm mesh size) • 46 mm gill nets • Perch traps • Live recaptures (all re-released) • Winter fisheries by scientists only (64 mm) • All individuals retrieved • 1949–present
Perch trap (PT) – for tagging 46/64 mm gillnet (GN) – for tagging 64 mm gillnet (PGN) – retrieved J F M A M J J A S O N D M J F M A f(t) f(t+1) 5 months 7 months pGN(t) pPT(t) pPGN(t+1) pGN(t+2) pPT(t+2) p(t) p(t+2) Discretizing the data Right-censoring
64 mm gill net 1 2 3 4 5 1 2 3 4 5 Age Kipling (1983), J. Anim. Ecol.
Specific objectives • We have exact measures on fishing effort • Is fishing mortality related to effort? • If so: does this apply to all size classes in both basins? • We have population size estimates and information about individual growth • Is natural survival density dependent? • Is dispersal density dependent? • If so: does this apply to all size classes in both basins?
Probability of survival-migration State 1, 2 or 3 i (1,1) i (1,2) i (1,3) i (2,1) i (2,2) i (2,3) i (3,1) i (3,2) i (3,3) Multistate models To State 1 State 2 State 3 From Capture probability pi+1 (1,1) pi+1 (1,2) pi+1 (1,3) Jolly MoVe-parameterisation (JMV) pi+1 (1) pi+1 (2) pi+1 (3) or Conditional Arnason-Schwartz parameterisation (CAS)
The transition parameter • May estimate a separate transition parameter (y) when conditioning on survival • yi,j = fi,j/Si S = fidelity-survival i = from-state j = to-state Note: S is estimated for the “from” state and p for the “to” state in CAS parameterisation
Pr(A): stays Pr(B): moves Parameterisation A: NSN… B: S0N…
GOF tests for CJS models • A fully efficient GOF test for the CJS model is based on the property that all animals present at any given time behave the same • whatever their past capture history (Test 3) • whether they are currently captured or not (Test 2)
NOW: GOF tests also for MS models • A fully efficient GOF test for the JMV model is based on the property that all animals present at any given time on the same site behave the same • whatever their past capture history (Test 3G) • whether they are currently captured or not (Test M) • Methods described in Pradel et al. 2003, Biometrics • U-Care 2.0 (ftp://ftp.cefe.cnrs-mop.fr/biom/Soft-CR/)
Model constraints (I) • Because of right censoring at winter occasions neither S or y is separatetly estimable for winter-to-spring intervals • Could set S=1 and y = 0 for these periods or force estimates to equal over both periods within a year • Last approach more often converged
Model constraints (II) • p could be estimated for each occasion • Three different methods used during spring • Different efforts and size selectivity • time models the only possibility • Same gillnets used during winter fisheries throughout the study • Could constrain according to effort • Could estimate size-dependent recruitment to fisheries • p-estimates performed under maximum temporal variation for S and y
Analysis outline • Analysis of natural survival • Using spring records only • Standard CJS modelling • Collapsing basin information • Exploring effects from gear and density • MS modelling • Including winter captures (fishing mortality) • Recruitment to fisheries • Between-basin dispersal
GOFs for CJS • For the 1953-1986 period • No evidence for lack of fit for the CJS model • No trap happiness or shyness
Length- and gear-specific recapture probability pa1(gear*length+length2), a>1(t)
perch disease Temporal variation in annual natural survival f(gear+t)
Fishing effort and natural survival f(gear+effortPGN)
Summary of the CJS results • Natural survival vary over time • decreased during 1960-1980 period • indication of density dependence? • Capture probability is gear and size specific • As known…
Final CAS model Sa1(basin*length),Sa>1(basin*popsize) Pspring(basin+t), PSwinter,a1(length), PNwinter,a1(.), Pwinter,a>1(basin+effort) yNSa1(length), yNSa>1(density gradient), ySN(t)
Length-dependent survival from tagging to first winter Sa1(basin*length)
Density-dependent survival for tagging age>1 Sa>1(basin*popsize)
Size- and basin-dependent dispersal during first year following tagging
Density- and basin-dependent dispersal for a>1 Increasing relative density in north
Summary • Indications of density-dependent dispersal and survival • Basin specific responses • Net migration from N to S • larger ones migrate with higher probability • 3-4 times higher fishing mortality in S • Once lengths of >55 cm is achieved fishing mortality increase with effort • Possible to predict recruitment to fisheries from spring length distributions • not for N
Further objectives to be addressed • Effect of sex • Population composition • Age/size structure • Effects from other environmental variables • Eutrophication • Prey abundance, i.e. perch abundance • Temperature