Download
1 / 18
470 likes | 1.36k Views
Fuel Consumption. “Number of vehicles”, “miles driven”, and “fuel consumption” data given in six categories by the FHWA: 1 Passenger Cars Buses Motorcycles Other 2-Axle, 4-Tire Vehicles Single Unit Trucks Combination Trucks. “Emissions” data given in four categories by EPA: 2

E N D
“Number of vehicles”, “miles driven”, and “fuel consumption” data given in six categories by the FHWA:1 Passenger Cars Buses Motorcycles Other 2-Axle, 4-Tire Vehicles Single Unit Trucks Combination Trucks “Emissions” data given in four categories by EPA:2 Light Duty Gas Vehicles and Motorcycles (LDGV&MC) Light Duty Gas Trucks (LDGT) Heavy Duty Gas Vehicles (HDGV) Diesels Data Consistency • Categories from FHWA converted to EPA Categories through:3 • LDGV&MC = .9864 (Passenger Cars) + Motorcycles • LDGT = .9918 (Other 2-axle, 4-tire vehicles) • HDGV = .1028 (Buses) + .7994 (Other Single Unit Trucks) • Diesels = .0136 (Passenger Cars) + .0082 (Other 2-axle, 4-tire vehicles) + .8972 (Buses) +.2006 (Other Single Unit Trucks) + 1.0000 (Combination Trucks)
Comparison between Fuel Consumption and Miles Driven Trends • Dips in “miles driven” (1974, 1978-1980 total; 1990-1994 LDGV&MC) correspond to decreases in “fuel consumption” but there are additional dips and longer dips in “fuel consumption” (1974 -75, 1978-1984, 1989-1992 total; 1990 - 2002 LDGV&MC). • Thus, there is not a one-to-one correlation between “miles driven” and “fuel consumption”
MPG per Model Year5 Compared to NationalVehicle Fleet MPG • Increase in fuel economy for MY 1975-86 vehicles corresponds to the increase in national vehicle fleet fuel economy from 1980 to 1991 • Leveling off of national vehicle fleet fuel economy after 1991 corresponds to slight decrease in fuel economy after 1986 • Lag occurs because vehicle turnover is not instantaneous (average vehicle age is 7-8 years)6
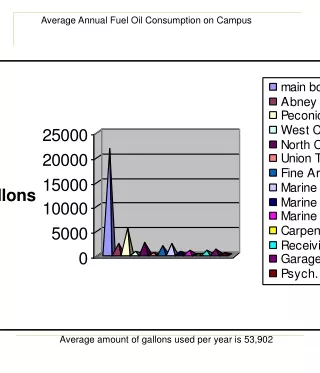
Fuel Consumption Summary • Fuel consumption trends are the result of a competition between vehicle use and fuel economy. • Vehicle use depends on many factors, including traffic congestion and personal driving habits. However, “miles driven” shows that the general trend is an almost continuous increase. • Increases in the national vehicle fleet fuel economy create short reductions in ”fuel consumption”, but the near continuous increase in “miles driven” causes the “fuel consumption” to trend upward
Important Emission Improvements • 1968 – Tailpipe emission standards first implemented for new cars to reduce VOC and CO emissions.6 • 1970 – Congress passes the Clean Air Act which calls for a 90% reduction in emissions by 1975. This deadline is later extended to 1980 for VOC and 1981 for NOx and CO emissions.7 • 1971 - New cars have to meet evaporative emission standards for the first time and charcoal canisters are introduced to collect VOC vapors.7,8 • 1972 - Exhaust gas recirculation valves are implemented to reduce NOx emissions.7 • 1975 – Most new cars have catalytic converters to reduce VOC and CO emissions.8 Unleaded gasoline introduced (with a 13% market share) since lead inactivates the catalytic converters. Market share climbs to 50% in 1982 and 100% in 1996.9 • 1980/81 – In response to implementation of CAA emission standards, new cars are equipped with three-way catalysts that optimize the efficiency of catalytic converters and reduce NOx emissions.7 • 1983 – Passenger Vehicles are first required to undergo testing for “malfunctioning emission control systems”.7
1990 – CAA Amendments passed including increasing testing requirements.7 Limit on diesel fuel sulfur content (to reduce SO2 and PM emissions) is set by EPA to take effect in 1993.9 • 1991 – Lower tailpipe standards set for VOC and NOx emissions to be phased in beginning in 1994.7 NOx emissions standards for new trucks and buses cut in half.10 • 1992 – Limits for CO emissions at cold temperatures are set to be phased in beginning in 1994.7 • 1993 – The Diesel PM standard for urban buses is reduced. This standard is further reduced in 1994 and 1996.11 • 1999 – SUV’s subject to same emissions standards as other vehicles for the first time. More restrictive standard for VOC, CO, NOx, and PM begin to be phased in (end 2008).7 Standard for sulfur content in gasoline is reduced to take effect in 2005.12 • 2000 –Standard for sulfur content of diesel fuel is again reduced to be phased in between in 2007 – 2010. By cleaning up the fuel, emission control technologies can finally be implemented in Diesel vehicles.13
CO Emissions • Overall emission trends determined by LDGV&MC emission trends • Lower emissions for HDGV, LDGT, and Diesels because of less use, as shown in “miles driven”. • The effect of the increase in LDGT use is minimized because the increase comes a few years after the emissions control improvements of 1980/81. • Continuous reduction in overall emissions due to improvements in control emission technology • Steeper drop after 1987 because by then average vehicle age(7-8 years)6 suggests that the average car was purchased after the 1980/81 improvements. • Leveling off after 1996 in LDGV&MC due to aging of fleet prior to replacement with MY 1994 and later vehicles and continued increase in vehicle use. • Decreased reduction in overall emissions after 1996 also due to the increased relative emissions of LDGT.
NOx Emissions • Overall emissions trends determined by LDGV&MC and Diesels • Reduction after 1987 in overall emissions is lessened by increase in emissions from diesel vehicles • Overall emissions decrease because of increased emission control technology in LDGV&MC. • Emissions from LDGV&MC level off after 1998 due to increased use and failure of MY 1994 improvements to have a significant impact yet. • Rise in Diesel emissions due to increased use and lack of emission technology for vehicles. Decrease after 1998 due to stricter MY 1991 emissions standards for truck and buses.
VOC Emissions • Overall emissions trends determined by LDGV&MC • Lower emissions for HDGV, LDGT, and Diesels because of less use, as shown in “miles driven”. • The effect of the increase in LDGT use is minimized because the increase comes a few years after the emissions control improvements of 1980/81. • Continuous reduction in overall emissions due to improvements in control emission technology. • Steeper drop after 1987 because by then average vehicle age (7-8 years)6 suggests that the average car was purchased after the 1980/81 improvements. • Leveling off in 1997 and 1998 in LDGV&MC due to aging of fleet prior to replacement with MY 1994 and later vehicles and continued increase in vehicle use.
SO2 Emissions • Overall emissions trends determined by Diesels • Increased relative contribution of LDGT corresponding to increase in use of LDGT. • Increase in diesel emissions until 1990 because of increased use and little improvement in emission control technology. • Drop after 1990 corresponds to desulphurization of diesel fuel. • Level off after 1996 due to increased relative contribution of LDGT and LDGV&MC. • Little change in LDGV&MC over time since this emission source is minor and thus has yet to be dealt with for LDGV&MC.
PM-10 Emissions • Overall emissions trends determined by LDGV&MC and Diesels • The effect of the increase in LDGT use is minimized because the increase comes a few years after the emissions control improvements of 1980/81. • Decrease in LDGV&MC corresponds to initial improvements in emission control technology. • Increase in diesel emissions until 1990 because of increased use and little improvement in emission control technology. • Drop after 1990 corresponds to desulphurization of diesel fuel.
Emission Factors (g/gal) • Decrease in Diesel NOx emission factor after 1998 corresponds to decrease in overall level of Diesel NOx emissions. • Almost continuous decrease in emissions factors for all three gasoline categories shows that emission reduction technology is working.
Emissions Factor (g/mile) • 2002 levels (LDGV&MC - 1.19 g/m NOx, 1.37 g/m VOC) are still significantly greater than 1996 emission standards (.41 NOx g/m and .25 g/m VOC)11. • Thus, emissions can be greatly reduced by replacing older cars with newer cars.
Emissions Summary • The trends are a result of the competition between the effectiveness of the emission control technology in the national vehicle fleet and vehicle use. • The improvements in emission control technology are effective enough to overcome the increase in vehicle usage. • NOx emissions can be significantly reduced by improving Diesel NOx emission technology since NOx emission factors for Diesel vehicles are 7 times that emission factor for all vehicles and Diesel NOx emissions are greater than the other three vehicle categories.
References • United States. Office of Highway Policy Information. Highway Statistics Summary to 1995 (Historical Summary to 1995): Table VM-201a. April 1997. http://www.fhwa.dot.gov/ohim/summary95/vm201a.pdf 23 March 2005. • United States. Environmental Protection Agency. 1970 - 2002 Average annual emissions, all criteria pollutants. January 2005. ttp://www.epa.gov/ttn/chief/trends/trends02/trendsreportallpollutants010505.xls 22 March 2005. • Tooly, Rebecca Lee. Procedures Document For National Emission Inventory Criteria Air Pollutants 1985-1999. United States Office of Air Quality. Environmental Protection Planning and Standards Agency. Research Triangle Park. NC March 2001. http://www.epa.gov/ttn/chief/trends/procedures/neiproc_99.pdf 22 March 2005. • United States. Environmental Protection Agency. What are Mobile Sources?http://www.epa.gov/otaq/invntory/overview/examples.htm#onr 31 March 2005. • Energy Futures, Inc. U.S. VEHICLE FUEL ECONOMY AT 20 YEAR LOW.http://www.energy-futures.com/samples/301cfr/g2.htm. 19 April 2005. • Dill, Jennifer. Transportation Research Board. “Older Vehicles and Air Pollution: Insights from the 1995 NPTS.” http://gulliver.trb.org/publications/circulars/ec026/23_dill.pdf. 17 April 2005. • United States. Environmental Protection Agency. Mobile Source Emissions -Past, Present, and Future: Milestones. http://www.epa.gov/otaq/invntory/overview/solutions/milestones.htm. 13 April 2005.
United States. Environmental Protection Agency. Automobile Emission: An Overview. http://www.epa.gov/otaq/consumer/05-autos.pdf. 17 April 2005. • United States. Environmental Protection Agency. National Air Pollutant Emission Trends: 1900-1998. March 2000. http://www.epa.gov/ttn/chief/trends/trends98/chapter3.pdf. 17 April 2005. • United States. Environmental Protection Agency. Diesel Exhaust in the United States. September 2002. http://www.epa.gov/otaq/retrofit/documents/f02048.pdf 24 April 2005. • United States. Environmental Protection Agency. Motor Vehicles and the 1990 Clean Air Act. http://www.epa.gov/otaq/consumer/11-vehs.pdf. 17 April 2005. • United States. Environmental Protection Agency. EPA National News. “CLEANER CARS AND CLEANER FUELS FOR THE 21ST CENTURY.” 21 Dec. 1999. http://yosemite1.epa.gov/opa/admpress.nsf/b1ab9f485b098972852562e7004dc686/0b8d5154df6d30a18525684e0077437d?OpenDocument. 20 April 2005. • United States. Environmental Protection Agency. Environmental News. “EPA DRAMATICALLY REDUCES POLLUTION FROM HEAVY-DUTYTRUCKS AND BUSES; CUTS SULFUR LEVELS IN DIESEL FUEL”. 21 Dec. 2000. http://www.epa.gov/otaq/regs/hd2007/frm/r-196.pdf 20 April 2005.