Download
1 / 5
50 likes | 204 Views
a. WB: anti-His anti-TAF9. His-Fiber. His-TAF9. His-Fiber. His-TAF9. His-TAF9. TAF9 shRNA. Ctrl shRNA. Gli BS-luc activity (%). Gli1 + TAF9. Gli2 + TAF9. b. biotin-p53 peptide. c.

E N D
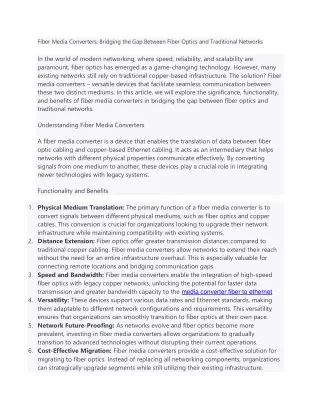
a WB: anti-His anti-TAF9 His-Fiber His-TAF9 His-Fiber His-TAF9 His-TAF9 TAF9 shRNA Ctrl shRNA Gli BS-luc activity (%) Gli1 + TAF9 Gli2 + TAF9 b biotin-p53 peptide c Figure S1. (a)Western blot of purified recombinant truncated His-hTAF91-140 and His-Fiber as detected by anti-His antibody. His-hTAF91-140 was verified by anti-TAF9 antibody. (b) ELISA showed direct binding between biotinylated p53 peptide (with putative TAF9 binding motif) and purified recombinant His-hTAF91-140 , but not the recombinant His-Fiber protein. (c)Gli dependent transcription activity was significantly inhibited by knocking down TAF9 expression with TAF9 shRNA in NSCLC cell line A549.
DMSO 10µM FN1-8 20µM FN1-8 a b Figure S2. Effect of FN1-8 on other transcription factors.(a)CREB and HIF binding sites-luciferase reporter activities in stable cell lines 293 and NIH3T3 (Panomics) were not affected by FN1-8 (10 and 20 µM, 1 day).(b) The SOCS3 promoter (with STAT3 binding sites, (He, et al. BBRC 2003)) activity in A549 cells was not affected by by FN1-8 (20 µM, 1 day). All the measured luciferase activities were normalized to pRL‑TK vector (Promega) activity. Results are means + S.D.
Normal lung cells FN1-8 Normal skin fibroblast Live cells (%) DMSO 10 µM FN1-8 20 µM FN1-8 1 2 3 4 5 6 Days a b DMSO 10 µM FN1-8 30 µM FN1-8 Live cells (%) Normal muscle cells Normal renal cells c Figure S3. Effect of FN1-8 on survival in several types of human normal cells. (a) Normal lung cells and(b) Normal muscle and renal cells were treated with different doses of FN1-8 for 4 days and then analyzed by flow cytometry. (c) Normal skin fibroblast were treated with different doses of FN1-8 and analyzed by MTS assay (time course). All results are mean values ± S.D. (error bars).
Kidney cortex Kidney medulla i.p. injection Concentration (ng/ml) Spleen Time (hrs) Lung Small intestine Colon b Vehicle FN1-8 Liver Ear FN1-8 Vehicle Counts (103/μl) Leukocyte population a c d DMSO FN1-8 DMSO FN1-8 Figure S4. Pharmacokinetic (PK) and toxicity studies of FN1-8 in mice. (a) PK study of FN1-8 in mice (n=3) by i.p. injection (30 mg/kg). Results are means±SD. (b), (c) and (d) are toxicity analyses of FN1-8 in mice harboring H460 tumors of the efficacy study described in Figure 6. Body weights of mice were monitored during the period of drug administration (b). Hematoxylin and eosin (H&E) staining of organs (c). Leukocytes (WBC: white blood cell, NE: neutrophil, LY: lymphocyte, MO: monocyte, EO: eosinophil, BA: basophil) from animals were collected and counted through a blood cell counter (d). Normal ranges (x103 counts/ul) for the leukocyte population are: WBC: 1.8-10.7; NE: 0.1-2.4; LY: 0.9-9.3; MO: 0-0.4; EO: 0-0.2; BA: 0-0.2.
Table S1. Peptide sequences for ELISA Table S2. Primer sequences for semi-quantitative RT-PCR