Download
1 / 20
210 likes | 304 Views
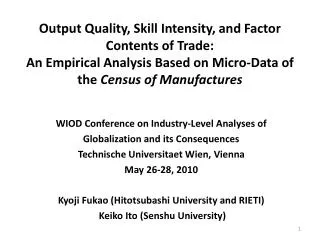
Level of population education and its economic consequences. Ladislav Kulčár M. Bel University Banská Bystrica Faculty of Economics Institute of Managerial Systems Branch Poprad, Slovakia. The aim of this contribution:. How to evaluate level of education in a society

E N D
Level of population education and its economic consequences Ladislav Kulčár M. Bel University Banská Bystrica Faculty of Economics Institute of Managerial Systems Branch Poprad, Slovakia
The aim of this contribution: • How to evaluate level of education in a society (in a country, region, district, institute, firm, ...) by one value. • To compare several ways of evaluation of the level of education expressed by, e.g.: - EI (Education Index) or EC (Education Coefficient) - EPS (Education Potential of a Society) - ALE (Average Length of Education) • To find a statistical relation (model?) between level of education and a measure of unemployment rate.
Education Index (EI): one part of Human Development Index (HDI) along with Gross Domestic Product Index and Life Expectancy Index EI = 2/3 adult literacy rate + 1/3 gross enrollment ratio EI ranges from 0 to 1 EI = 0,928 for Slovakia EI = 0,938 for Czech Republic for 2006
Education Coefficient (EC): (e.g. Klas, 2000) - ratio of tertiary (university) educated population, - ratio of secondary educated population, - ratio of other (primary, unfinished, without any education) population of productive age EC1 = 1,82 for Slovakia (1995) • Level of Education (LE): (Project Constantine, 1994) LE = 1,71 for Slovakia (1991)
Index of Education (iED): (Střeleček, Zdeněk, 2006) • or • or (for see below) • Very close relations among all of the mentioned measures of education level for 79 districts of Slovakia: correlation coefficient 0,9351 – 0,9995 • It does not matter which one of these measures will be used to express the education level of a society in practice because of a very close statistical relation between them.
Education potential of society (EPS): where: k – a serial number of the education level ordered in an ascending scale in this way: without education (k = 0), basic (primary) education (k = 1), ...., the highest level of education (k = r), r – the value allocated to the highest level of education, r = max (k), in our case (Slovakia) r = 7, - relative frequency (ratio) of population with the k-th level of education.
Allocation of the k value to the highest level reached during the formal institutional education (for Slovakia nowadays): k = 0 – without any education, no level of education k = 1 – elementary (basic, primary) education level (9 school years), k = 2 – education level without General Certificate of Education (GCE), apprentice and specialized schools focused on practice (usually 3 school years), k = 3 – secondary and comprehensive schools with GCE exams (usually 4 school years), k= 4 – post-secondary specialized vocational qualificatory schools with GCE exams (usually 2 years), k = 5 – bachelor (college) level of education (usually 3 years, Bc.), k = 6 – university level (usually 2-3 years, Dr., Mgr., Ing.) k = 7 – post-doctoral level (usually 3 – 5 years, PhD.)
Requirement for the EPS evaluation: We have to know the relative frequency distribution of the education level in a population. Two extreme cases: • If all people in a society have no education: EPS = 1/r = 1/7 • If all people in a society reached the highest education level:
Example for real case: district Trebišov (Slovakia) EPS = 0,22031
Average length of education (ALE): where is the weighted value of all lengths of education (schooling) up to the moment when an individual reached the k-th level of education (i.e. his/her highest level). The values used in our case ( for Slovakia): 0,0 years (for k = 0) 15,4 years (for k = 5) 8,6 years (for k = 1) 17,5 years (for k = 6) 11,6 years (for k = 2) 21,5 years (for k = 7) 12,4 years (for k = 3) 14,4 years (for k = 4)
Education level and unemployment rate in Slovakia (2001) • Our aim: To find statistical model based on mutual relation between ALE and UE values for Slovakia • Problem: Unemployment rate is much more sensitive in time than level of education
Data used: • ALE values were chosen as a measure of education level (more illustrative values than the other measures) • ALE values for 79 districts of Slovakia (source of data: Statistical Office of the Slovak Republic, population and housing census in 2001). • The ALE values range from 11,32780 years (district Kežmarok) up to 14,6153 years (district Bratislava I). • Unemployment (UE) rate (in percentage of the economic active people)
Relation between ALE and unemployment rate for 79 districts of Slovakia (2001)
The following regression functions were used for modelling the relation between UE and ALE: - Reciprocal: - Double reciprocal: - Exponential: - Multiplicative:
The following measures for quality of fitted models were used : • Standard error of estimate • Index of determination • M.S.E. • M.A.P.E. (measures mostly used in times series analysis) Conclusion: The best fitted model: reciprocal regression model
Statistical model between UE and ALE • Reciprocal model: • Interpretation of the 10,51 value: minimum value of the ALE = minimum number of years of schooling (in good accordance with reality in Slovakia)
Statistical model between UE and ALE in a real stable economy: • Characteristics of the function: Hyperbolic function with the horizontal and the vertical asymptotes at: • UE(min) = 5 % (for stable economy) • ALE(min) = 10,51 years of schooling (for Slovakia) • C = constant (for Slovakia C = 23,85)