Download
1 / 25
250 likes | 408 Views
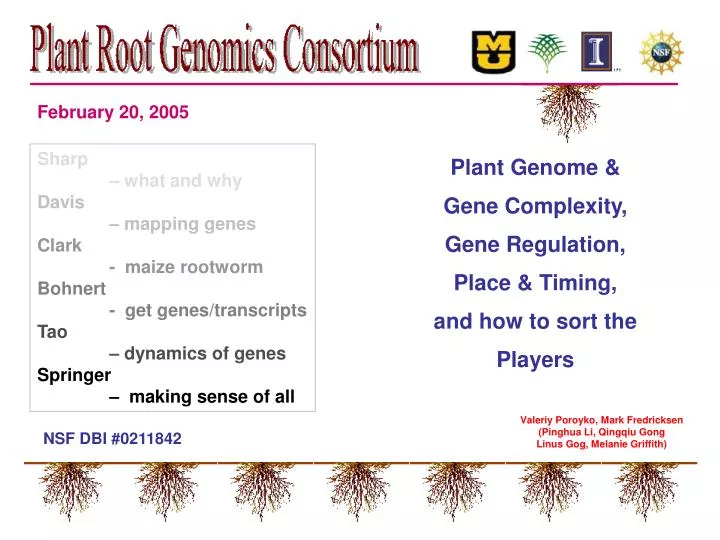
February 20, 2005. Sharp – what and why Davis – mapping genes Clark - maize rootworm Bohnert - get genes/transcripts Tao – dynamics of genes Springer – making sense of all. Plant Genome & Gene Complexity, Gene Regulation, Place & Timing,

E N D
February 20, 2005 Sharp – what and why Davis – mapping genes Clark - maize rootworm Bohnert - get genes/transcripts Tao – dynamics of genes Springer – making sense of all Plant Genome & Gene Complexity, Gene Regulation, Place & Timing, and how to sort the Players Valeriy Poroyko, Mark Fredricksen (Pinghua Li, Qingqiu Gong Linus Gog, Melanie Griffith) NSF DBI #0211842
Ploidy changes - a recurring process • Many ‘diploid’ species have gone through ploidy changes • Fusions of related species new species The Plant Genome Diploid Polyploid Chrysanthemum species illustrate the phenomenon. Monoploid number (the basic set) = 9 chromosomes In Chrysanthemum species, the number of chromosomes fall into 5 categories: 18 chromosomes = diploid (2 copies of the monoploid) 36 chromosomes = tetrapoid (4 copies of the monoploid) 54 chromosomes = hexapoid (6 copies of the monoploid) 72 chromosomes = octaploid (8 copies of the monploid) 90 chromosomes = decaploid (10 copies of the monoploid) 50% of all flowering plants are polyploid. See: Arabidopsis
10 20 30 5 Mb PIP1;3 TIP3;2 TIP2;xpseudo TIP3;1 NIP6;1 NIP3;1 Ch-1 (15) PIP2;8 NIP3;1pseudo TIP4;1 NIP2;1pseudo NIP2;1 PIP2;6 PIP1;2 Ch-2 (4) rDNA TIP1;1 PIP2;2 PIP2;3 SIP1;1 NIP7;1 TIP2;1 TIP1;2 TIP5;1 PIP2;1 SIP2;1 Ch-3 (14) PIP1;1 PIP2;5 PIP1;4 TIP1;3 NIP5;1 TIP2;2 NIP1;1 NIP1;2 PIP1;5 PIP2;7 Ch-4 (3) SIP1;2 NIP4;1 NIP4;2 TIP2;3 PIP2;4 Ch-5 (12) - duplicated regions that include AQPs. AQP are distributed over all Chromosomes - a few clusters, many duplications Figure 3
O3 CO2 control Columbia grown in Soy-FACE Arabidopsis – model plant small, fast, prolific, mutants, lines, ecotypes, genome sequence Field on a dish!
Arabidopsis growing in the field in high CO2 and/or ozone FACE-rings down there concept plant performance in the future earth’ atmosphere (~2040) - also: soy, corn, weeds
Ecosystem – population – species – ecotype (breeding line) Organism – organ – tissue – cell – compartment Nucleus – envelope & pore – nucleoplasm, nucleolus & chromosomes Euchromatin & heterochromatin – gene islands – gene Promoters – 5’-regulatory – introns & exons - coding region – 3’-regulatory regions The Plant Genome Plants in silico? Sure! And then: Plant Design from Scratch
Controls for Gene Expression – many Switchboards The Plant Genome • Chromatin condensation state • Local chromatin environment • Transcription initiation • Transcript elongation • mRNA splicing • mRNA export • mRNA place in the cell • RNA half-life • Killer microRNAs • Ribosome loading • Protein transport/targeting • Protein modifications • Protein turnover Levels of regulation that affect what we call “gene expression”
binding site for Pol-II sometimes recognizable promoter REs ABRE DREB ERE response elements for every condition number spacing 3’ – variable, condition-dependent 5’ splicing & alternative splicing Watch out – not only activators may bind, but repressors as well! - think about: you may need an activator to make a protein that removes a repressor.
no protein - gene is essentially “silenced” The Plant Transcriptome 5 years ago, we did not know that such a control system existed! Killer RNAs (there are micro-genes) microRNAs
The Plant Transcriptome How to sample the transcriptome? Morphological dissection remember Bob Sharp’s talk! (root, leaf, flower - epidermis, guard cell, etc.) Cell sorting make single cells, send through cell sorter (size, color, reporter gene) Laser ablation micromanipulation of laser to cut individual cells Biochemical dissection chloroplasts, mitochondria, ribosomes, other membranes Painting cells with a reporter gene - here this is GFP Green Fluorescence Protein
The Plant Transcriptome Painting tissues then isolating desired cells Enzymatic staining The Endodermis of the root tip is highlighted in transgenic plants using pSCR::mGFP5.
Cell-Specific GFP Expression • Catalog of available transgenic Arabidopsis lines. • Lines are available from the stock centers. • However, the molecular basis for the observed phenotype is usually uncharacterized.
The Plant Transcriptome cDNA – complementary DNA converts messenger RNA into double-stranded DNA • > cDNA libraries • “neat” • normalized • subtracted • > SAGE libraries “Normalization” removes mRNAs for which there are many copies in a cell – thus enriching for “rare mRNAs” (not so much sequencing to do) Subtraction removes cDNAs which you already know (less sequencing)
Primary cDNA Library Library Normalization Total RNA primary cDNA library make ss-DNA out of primary library Poly(A)+ RNA 1st strand cDNA PCR inserts by T7 and T3 standard primers ss-DNA ds-cDNA DNA “tracer” Size-selected double stranded cDNA (>500 bp) DNA “driver” tracer/driver hybridization Ligate to EcoRI adapters/digest NotI column chromatogr. (double-strands stick) Clone (EcoRI/NotI) digested pBSII/SK+ & adaptored cDNA Primary (neat) library may be used for “normalization” Non-hybridized DNA from flow-through = normalized clones The Plant Transcriptome cDNA Libraries Cloning of root RNAs from segments S1 – S4 root tip (Sharp lab) sequenced ~18,000 clones found ~8,000 unique and ~130 novel genes How many genes make a root?
The Plant Transcriptome SAGE – Serial Analysis of Gene Expression – an Overview Isolate small regions (SAGE tags) of each mRNA transcript in a cell Isolate total RNA from cells or tissue Digest tags and ligate into concatamers for sequencing Reference sequencing results against public databases
FR697, 48 h after transplanting (from cell length profiles) WW00 WS05 WS48 WW 4 segments each barcoded then normalized sequence 6,000 from ~17,000 seqs ~8,000 different mRNAs ~800 never found before in any organism WS
WS05 WW00 SAGE 461 ESTs 476 SAGE: 1076 ESTs: 1743 SAGE: 969 ESTs: 1603 SAGE 700 ESTs 640 SAGE 417 ESTs 542 SAGE 477 ESTs 576 SAGE: 1031 ESTs: 2071 WS48 SAGE tags and EST contigs recognized in three corn root libraries. Problem - how to understand what the meaning of 8,000 genes might be! Figure 7
Translation & ribosomes Chromatin-associated functions Cell cycle control & maintenance
Nucleotide transport & metabolism Secondary metabolite dynamics Ion transport
Importing data into Pathways – biochemical, developmental, regulatory MapMan
The Plant Transcriptome Quantitative PCR in 384-well plates (96 primer pairs, 3 repeats each) Taking SAGE & cDNA sequences together - corn roots “express” 20-23,000 genes (i.e., mRNA is made) - The entire corn genome is expected to include ~50,000 genes
Why are we doing this? • Genes expressed in well-watered conditions, • how many, where and which? • Changes during drought episodes? • Variation in different lines or land races? • Breeders to cross and select for tolerance! • Proteins and substances (metabolites) made? • (how to make a cell wall, how to defend against rootworms) • Make corn with thicker (modified) cell walls!
Transcript Dynamics – Wenjing Tao is next mRNA 2 mRNA 1 DNA Reverse Transcription labelling using Cy5 and Cy3 dyes Array onto glass slides using Robotic Gridder Block reactive groups Fix & denature DNA cDNA 1-cy3 cDNA 2-cy5 Measuring the ratio of expression (control to test Population) Hybridize
Thimm O, Blasing O, Gibon Y, Nagel A, Meyer S, Kruger P, Selbig J, Muller LA, Rhee SY, Stitt M. (2004) MAPMAN: a user-driven tool to display genomics data sets onto diagrams of metabolic pathways and other biological processes. Plant J. 37(6):914-39. http://gabi.rzpd.de/projects/MapMan/ The program can be downloaded from this site. As soon as I can, I will put together some real data (published data) that you could insert into the program and then manipulate.