Download
1 / 30
300 likes | 420 Views
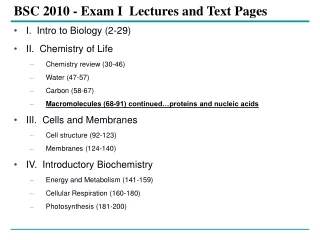
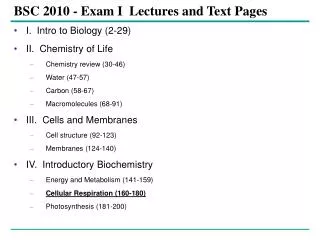
BSC 2010 - Exam I Lectures and Text Pages. I. Intro to Biology (2-29) II. Chemistry of Life Chemistry review (30-46) Water (47-57) Carbon (58-67) Macromolecules (68-91) III. Cells and Membranes Cell structure (92-123) Membranes (124-140) IV. Introductory Biochemistry

E N D
BSC 2010 - Exam I Lectures and Text Pages • I. Intro to Biology (2-29) • II. Chemistry of Life • Chemistry review (30-46) • Water (47-57) • Carbon (58-67) • Macromolecules (68-91) • III. Cells and Membranes • Cell structure (92-123) • Membranes (124-140) • IV. Introductory Biochemistry • Energy and Metabolism (141-159) • Cellular Respiration (160-180) • Photosynthesis (181-200)
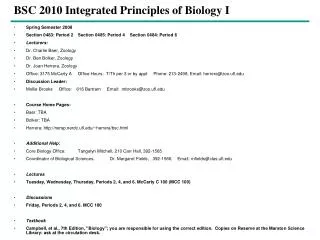
Citric Acid Cycle • Citric acid cycle completes the energy-yielding oxidation of organic molecules • The citric acid cycle • Takes place in the matrix of the mitochondrion
Pyruvate(from glycolysis,2 molecules per glucose) Oxidativephosphorylation Glycolysis Citricacidcycle ATP ATP ATP CO2 CoA NADH + H+ Acetyle CoA CoA CoA Citricacidcycle 2 CO2 3 NAD+ FADH2 FAD 3 NADH + 3 H+ ADP + Pi ATP Figure 9.11 An overview of the citric acid cycle
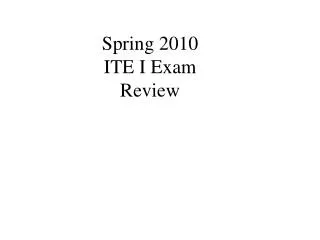
Citric acid cycle Oxidative phosphorylation Glycolysis S CoA C O CH3 Acetyl CoA CoA SH H2O O C COO– NADH 1 COO– CH2 + H+ COO– CH2 COO– NAD+ Oxaloacetate 8 C COO– HO CH2 2 CH2 HC COO– COO– COO– HO CH HO CH Malate Citrate COO– CH2 Isocitrate COO– CO2 Citric acid cycle 3 H2O 7 NAD+ COO– NADH COO– CH + H+ Fumarate CH2 CoA SH HC a-Ketoglutarate CH2 COO– C O 4 6 SH CoA COO– COO– COO– CH2 5 CH2 FADH2 CO2 CH2 CH2 NAD+ FAD C O COO– Succinate NADH CoA S P i + H+ Succinyl CoA GDP GTP ADP ATP Figure 9.12 A closer look at the citric acid cycle Figure 9.12
Pyruvate AcetylCoA Citric Acid Cycle Yield from each 2 pyruvate molecules (from 1 glucose) • 6CO2 (2 from Pyr.AcetylCoA, 4 from CAC • 8NADH (2 from Pyr. AcetylCoA, 6 from CAC) • 2FADH2 (All from CAC) • 2 ATP (All from CAC) Two pyruvates are produced from the glycolysis of each glucose molecule resulting in a total of 2 ATP from Citric Acid Cycle, and the NADH and FADH2 go to power the Electron Transport Chain
Oxidative phosphorylation • Chemiosmosis couples ETC to ATP synthesis • ETC (fig 9.13) = collection of mostly proteins embedded in the inner mitochondrial membranes (cristae = foldings that increase SA) • Each electron acceptor along the ETC is more electronegative than the previous O2 at the end, the final electron acceptor (most electronegative) • NADH transfers e- to the 1st molecule of ETC (flavoprotein) in multiprotein complex I • Ubiquinone (= small hydrophobic non-protein that’s mobile within the membrane system) transfers e- from multiprotein complex I II • FADH2 transfers e- to the 2nd multiprotein complex (provides 1/3 less E than NADH) • ATP is not directly made by the ETC Chemiosmosis couples this E release with making ATP • ETC – stores energy by pumping protons from the matrix across the inner mitochondrial membrane into the intermembrane space. (fig. 9.15) • Chemiosmosis = E stored in H+ gradient across a membrane (proton-motive force) is used to drive ATP synthesis • ATP synthase complexes in the membrane = only place H+ can freely move along concentration gradient and back into the matrix (fig. 9.14)
Oxidative Phosphorylation • During oxidative phosphorylation, chemiosmosis couples electron transport to ATP synthesis • NADH and FADH2 • Donate electrons to the electron transport chain, which powers ATP synthesis via oxidative phosphorylation through chemiosmosis
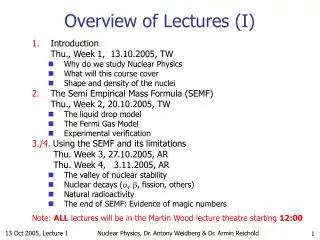
NADH 50 FADH2 Multiproteincomplexes I 40 FAD FMN II Fe•S Fe•S O III Cyt b 30 Fe•S Cyt c1 IV Free energy (G) relative to O2 (kcl/mol) Cyt c Cyt a Cyt a3 20 10 0 O2 2 H + + 12 Figure 9.13 H2O The Pathway of Electron Transport • In the electron transport chain • Electrons from NADH and FADH2 lose energy in several steps NADH passes electrons to multiprotein complex I. They are then passed to Ubiquinone which transfers them to multiprotein complex II. FADH2 passes electrons directly to multiprotein complex II. Electrons are passed to more electron acceptors in the remaining multiprotein complexes. Finally they are passed to oxygen, the most electronegative acceptor, forming water.
ETC stores energy in an ion gradient • At certain steps along the electron transport chain • Electron transfer causes protein complexes to pump H+ from the mitochondrial matrix to the intermembrane space • The resulting H+ gradient • Stores energy • Drives chemiosmosis in ATP synthase • Is referred to as a proton-motive force
Chemiosmosis • Chemiosmosis • Is an energy-coupling mechanism that uses energy in the form of a H+ gradient across a membrane to drive cellular work
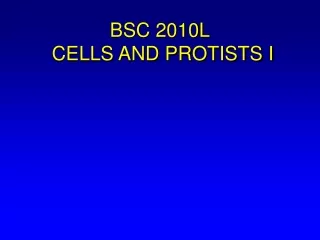
A rotor within the membrane spins clockwise whenH+ flows past it down the H+ gradient. INTERMEMBRANE SPACE H+ H+ H+ H+ H+ H+ H+ A stator anchoredin the membraneholds the knobstationary. A rod (for “stalk”)extending into the knob alsospins, activatingcatalytic sites inthe knob. H+ Three catalytic sites in the stationary knobjoin inorganic Phosphate to ADPto make ATP. ADP + ATP P i MITOCHONDRIAL MATRIX Figure 9.14 Chemiosmosis: The Energy-Coupling Mechanism • ATP synthase • Is the enzyme that actually makes ATP
Inner Mitochondrial membrane Oxidative phosphorylation. electron transport and chemiosmosis Glycolysis ATP ATP ATP H+ H+ H+ H+ Cyt c Protein complex of electron carners Intermembrane space Q IV I III ATP synthase Inner mitochondrial membrane II H2O FADH2 2 H+ + 1/2 O2 FAD+ NADH+ NAD+ ATP ADP + P i (Carrying electrons from, food) H+ Mitochondrial matrix Chemiosmosis ATP synthesis powered by the flow Of H+ back across the membrane Electron transport chain Electron transport and pumping of protons (H+), which create an H+ gradient across the membrane Figure 9.15 Oxidative phosphorylation Chemiosmosis and the electron transport chain
Energy Transfer Efficiency • Complete oxidation of 1 mole of glucose releases 686 kcal of energy • Phosphorylation of ADP ATP stores 7.3 kcal/mol • Respiration makes 38 ATP (x 7.3 kcal/mol) = 277.4 kcal (40% of 686 kcal) • Only about 40% of E stored in glucose is used to make ATP (the rest is lost as HEAT)
An Accounting of ATP Production by Cellular Respiration • During respiration, most energy flows in this sequence • Glucose to NADH to electron transport chain to proton-motive force to ATP
Electron shuttles span membrane MITOCHONDRION CYTOSOL 2 NADH or 2 FADH2 2 FADH2 2 NADH 2 NADH 6 NADH Glycolysis Oxidative phosphorylation: electron transport and chemiosmosis Citric acid cycle 2 Acetyl CoA 2 Pyruvate Glucose + 2 ATP + 2 ATP + about 32 or 34 ATP by oxidative phosphorylation, depending on which shuttle transports electrons from NADH in cytosol by substrate-level phosphorylation by substrate-level phosphorylation About 36 or 38 ATP Maximum per glucose: Figure 9.16 Three main processes in this metabolic enterprise About 40% of the energy in a glucose molecule is transferred to ATP during cellular respiration, making approximately 38 ATP
Fermentation Fermentation = extension of glycolysis that can generate ATP solely by substrate-level phosphorylation (as long as there’s plenty of NAD+) by transferring e- from NADH to pyruvate (or its derivatives). Does not use oxygen. 2 common types of fermentation: 1.Alcohol fermentation (fig 9.17a) • Pyruvate ethanol (2 steps) • 1st step: releases CO2 from pyruvate acetaldehyde (2-C) • 2nd step: acetaldehyde reduced by NADH ethanol • NAD+ continues glycolysis • Used to make beer/wine and in baking 2.Lactic acid fermentation (fig 9.17b) • Pyruvate lactate • Used to make cheese & yogurt (bacteria and fungi) • Your muscles also make ATP this way when O2 is scarce Facultative anaerobes = organisms that can either use pyruvate in fermentation OR in respiration (depending of O2 availability) To make the same amt of ATP an organism w/o O2 would have to consume sugar at a much faster rate
Fermentation enables some cells to produce ATP w/o oxygen: • In aerobic respiration, O2 pulls e- through the ETC • Yields up to 19 times more ATP • w/o O2, other e- acceptors can be used • Glycolysis = exergonic process that uses NAD+ (not O2) as an e- acceptor
Fermentation • Fermentation enables some cells to produce ATP without the use of oxygen • Cellular respiration • Relies on oxygen to produce ATP • In the absence of oxygen • Cells can still produce ATP through fermentation
Glycolysis • Glycolysis • Can produce ATP with or without oxygen, in aerobic or anaerobic conditions • Under anaerobic conditions, it couples with fermentation to produce ATP
Types of Fermentation • Fermentation consists of • Glycolysis plus reactions that regenerate NAD+, which can be reused by glyocolysis
P1 2 ATP 2 ADP + 2 O – C O C O Glucose Glycolysis CH3 2 Pyruvate 2 NADH 2 NAD+ 2 CO2 H H H C O C OH CH3 CH3 2 Ethanol 2 Acetaldehyde (a) Alcohol fermentation P1 2 ATP 2 ADP + 2 Glucose Glycolysis O– C O C O 2 NADH 2 NAD+ CH3 O C O H OH C CH3 2 Lactate (b) Lactic acid fermentation Figure 9.17 Alcohol Fermentation • In alcohol fermentation • Pyruvate is converted to ethanol in two steps, one of which releases CO2 2 pyruvate
P1 2 ATP 2 ADP + 2 O – C O C O Glucose Glycolysis CH3 2 Pyruvate 2 NADH 2 NAD+ 2 CO2 H H H C O C OH CH3 CH3 2 Ethanol 2 Acetaldehyde (a) Alcohol fermentation P1 2 ATP 2 ADP + 2 Glucose Glycolysis O– C O C O 2 NADH 2 NAD+ CH3 O C O H OH C CH3 2 Lactate (b) Lactic acid fermentation Figure 9.17 Lactic Acid Fermentation • During lactic acid fermentation • Pyruvate is reduced directly by NADH to form lactate as a waste product 2 pyruvate
Fermentation and Cellular Respiration Compared • Both fermentation and cellular respiration • Use glycolysis to oxidize glucose and other organic fuels to pyruvate • Fermentation and cellular respiration • Differ in their final electron acceptor • Cellular respiration • Produces more ATP
Glucose CYTOSOL Pyruvate No O2 present Fermentation O2 present Cellular respiration MITOCHONDRION Ethanol or lactate Acetyl CoA Citric acid cycle Figure 9.18 Pyruvate • Pyruvate is a key juncture in catabolism
The Evolutionary Significance of Glycolysis • Glycolysis • Occurs in nearly all organisms • Probably evolved in ancient prokaryotes (3.5 bya) before there was oxygen in the atmosphere • They did not have oxygen or mitochondria
Versatility in Catabolism • Glycolysis and the citric acid cycle connect to many other metabolic pathways • Our bodies generally use many sources of energy in respiration (fig 9.19) regulated by feedback inhibition (fig 9.20) • Carbohydrates simple sugars, enter glycolysis • Proteins amino acids (used to build new proteins) • Excess amino acids are deaminated intermediates of glycolysis or citric acid cycle, or form acetyl CoA • Fats gylcerol + fatty acids (where most E stored) • Gylcerol intermediate of glycolysis • Beta oxidation breaks fatty acids down to 2-C fragments citric acid cycle as acetyl CoA
The Versatility of Catabolism • Catabolic pathways • Funnel electrons from many kinds of organic molecules into cellular respiration • Glycolysis and the citric acid cycle connect to many other metabolic pathways
Fats Carbohydrates Proteins Amino acids Fatty acids Sugars Glycerol Glycolysis Glucose Glyceraldehyde-3- P NH3 Pyruvate Acetyl CoA Citric acid cycle Oxidative phosphorylation Figure 9.19 The catabolism of various molecules from food
Biosynthesis (Anabolic Pathways) • The body • Uses small molecules to build other substances • These small molecules • May come directly from food or through glycolysis or the citric acid cycle
Glucose AMP Glycolysis Stimulates Fructose-6-phosphate + Phosphofructokinase – – Fructose-1,6-bisphosphate Inhibits Inhibits Pyruvate Citrate ATP Acetyl CoA Citric acid cycle Oxidative phosphorylation Figure 9.20 Regulation of Cellular Respiration via Feedback Mechanisms • Cellular respiration • Is controlled by allosteric enzymes at key points in glycolysis and the citric acid cycle • Releases energy, but does not produce it.