Download

1 / 12
120 likes | 240 Views
Electric Utility Greenhouse Gas Emissions Reduction. Initial Rule Development Workshop August 22, 2007 Department of Environmental Protection Division of Air Resource Management. Governor’s Executive Order 07-127.

E N D
Electric Utility Greenhouse Gas Emissions Reduction Initial Rule Development Workshop August 22, 2007Department of Environmental ProtectionDivision of Air Resource Management
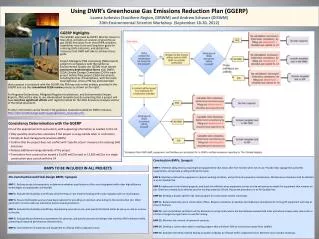
Governor’s Executive Order 07-127 “The Secretary of Environmental Protection shall immediately develop rules as authorized under Chapter 403, Florida Statutes, to achieve the following: Adoption of a maximum allowable emissions level of greenhouse gases for electric utilities in the State of Florida. The standard will require at minimum three reduction milestones as follows: by 2017, emissions not greater than Year 2000 utility sector emissions; by 2025, emissions not greater than Year 1990 utility sector emissions; by 2050, emissions not greater than 20% of Year 1990 utility sector emissions (i.e., 80% reduction of 1990 emissions by 2050)”
Year 2000 & Year 1990 Utility Greenhouse Gas Emissions First estimates: • Year 2000: 135,080,858 tons CO2 • Year 1990: 100,109,860 tons CO2 Year 2000 value from eGrid (Emissions & Generation Resource Integrated Database) developed by EPA, Office of Atmospheric Programs, Climate Protection Partnerships Division. http://www.epa.gov/cleanenergy/egrid/index.htmYear 1990 data estimated by applying ratio of 1990/2000 utility emissions from EPA State Inventory Tool to Year 2000 value.
Year 2004 Utility Greenhouse Gas Emissions Coal 65,484,849 tons CO2 Oil & petcoke 33,404,545 tons CO2 Natural gas 44,846,881 tons CO2 • Total fossil fuel 143,736,276 tons CO2 All emissions data from eGrid. Does not include 1,265,244 tons CO2 emissions from burning of non-biogenic solid waste such as plastics and tires in waste-to-energy facilities.Fossil-fuel electricity generation accounts for about 45% ofFlorida’s greenhouse gas emissions
Required Utility Greenhouse Gas Reductions from Year 2004 Levels • By 2017 6% • By 2025 30% • By 2050 86% • But, electric power usage in the state is growing…
Year 2004 Net Generation by Source • Fossil-fuel generation • Coal 61,982,540 MWh • Oil & petcoke 37,232,873 MWh • Natural gas 76,624,773 MWh • Interchange power 18,649,000 MWh • Subtotal 194,489,186 MWh (83% of grand total) • Other generation • Biomass 4,950,744 MWh • Nuclear 31,215,576 MWh • Hydroelectric 265,258 MWh • Other waste & phosphate* 2,862,650 MWh • Grand Total 233,783,414 MWh Interchange data from Florida Reliability Coordinating Council;all other data from eGrid. eGrid assigns 70% of generation fromsolid waste to biomass; 30% to other waste (plastics, tires, etc.).*Includes waste heat cogeneration in phosphate industry.
Projected Electricity Usage Year 2016: 325,566,000 MWh • Equates to 33% increase from actual 2006 net generation—same rate of increase as from 1996 to 2006 Year 2016 projection from “2007 Regional Load and Resource Plan” by Florida Reliability Coordinating Council, available on Public Service Commission website at: www.psc.state.fl.us/utilities/electricgas/10yearsiteplans.aspx. No Year 2017, 2025 or 2050 projections available.
Year 2004 Average CO2 Emission Rates for Florida Fossil-Fuel Units Coal 2,113 lb/MWh Oil & petcoke 1,794 lb/MWh Natural gas 1,171 lb/MWh • Weighted avg. 1,635 lb/MWh
CO2 Emission Rates for Fossil-Fuel Generating Units Compared • Year 2004 statewide average emission rate: 1,635 lb/MWh • Statewide average emission rate to meet 135 million ton cap with total generation of 325 million MWh, 83% of which supplied by fossil fuel (values selected for illustrative purposes; not a DEP-presumed scenario) 1,000 lb/MWh • Emission rates achievable by today’s new units: • Natural gas combined cycle 800 lb/MWh • Pulverized coal or IGCC 1,750 lb/MWh(w/o carbon capture & storage)
Challenges in Meeting the Caps • Slowing the state’s growth in electricity usage • Increasing generation from proven non-fossil sources • Reducing statewide average fossil fuel emission rate • Developing and deploying advanced technologies
Initial Rule Development Issues • Definition of electric utility sector • Nailing down Year 2000 and Year 1990 utility sector emission levels • How to treat out-of-state interchange power • Possible rule approaches
Comments • Mail to: Mr. Larry George, Program Administrator Division of Air Resource Management, MS-5500 Department of Environmental Protection 2600 Blair Stone Rd. Tallahassee, FL 32399-2400cc: Ms. Lynn Scearce, Rules Coordinator (same address) • Or e-mail to: larry.george@dep.state.fl.usandlynn.scearce@dep.state.fl.us • All comments are public records and will be posted on the department’s website at www.dep.state.fl.us/air • To receive updates on this rule development project bye-mail, provide name, affiliation, and e-mail address toMs. Lynn Scearce atlynn.scearce@dep.state.fl.us