Download
1 / 22
220 likes | 390 Views
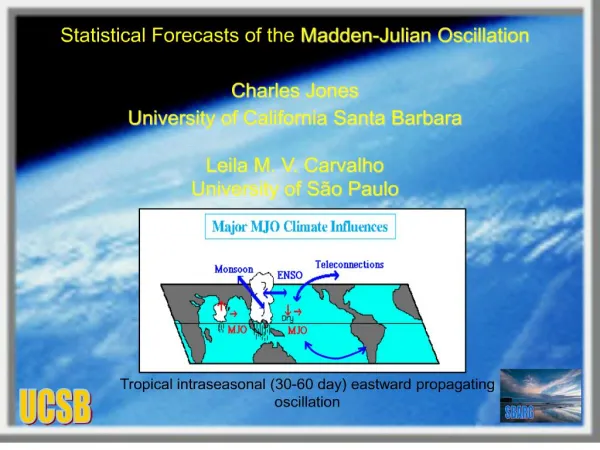
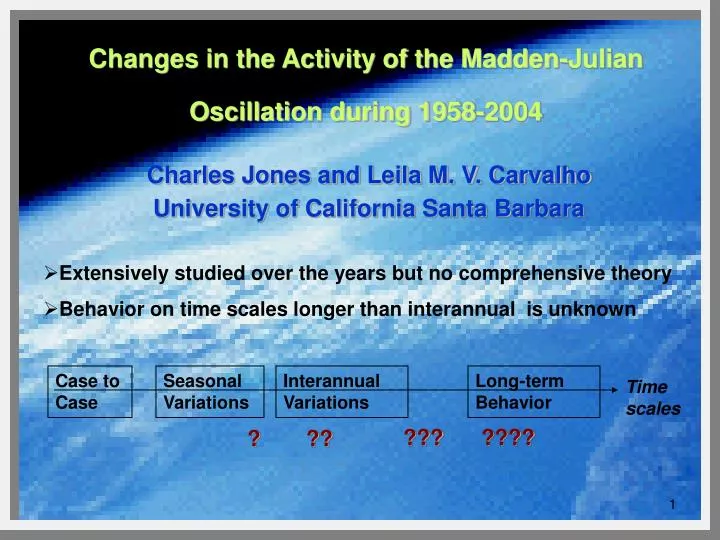
Changes in the Activity of the Madden-Julian Oscillation during 1958-2004. Charles Jones and Leila M. V. Carvalho University of California Santa Barbara. Extensively studied over the years but no comprehensive theory Behavior on time scales longer than interannual is unknown. Case to Case.

E N D
Changes in the Activity of the Madden-Julian Oscillation during 1958-2004 Charles Jones and Leila M. V. Carvalho University of California Santa Barbara • Extensively studied over the years but no comprehensive theory • Behavior on time scales longer than interannual is unknown Case to Case Seasonal Variations Interannual Variations Long-term Behavior Time scales ??? ???? ? ??
This Study • Are there linear trends in the activity of the MJO? (intensity & number of events) • Does the MJO exhibit regimes of high and low activity? • Are there significant seasonal differences in the activity of the MJO on time scales longer than interannual? Note: MJO refers to summer and winter events
Identification of MJO events • NCEP/NCAR U200, U850 (1958-2004) 20-100 day anomalies • OLR (1979-2004) 20-100 day anomalies • EOF analysis • Summer domain: south Asian monsoon (Lawrence and Webster 2001) • Winter domain: Equatorial region (Kessler 2001) • Event: amplitude PC1 exceeds 1 sigma • within 20 days PC2 exceeds 1 sigma • Events registered at pentads in which PC1 exceed 1 sigma • 1958-2004: 158 events (75 in summer; 83 in winter) (U200,U8500) • 1979-2004: 90 events (49 summer; 41 winter) (OLR)
MJO Events more frequent in some years than in other periods • 158 events (1958-2004) identified with CEOF (U200, U850) (correlation matrix) • Each bar represents an event registered at peak in PC1 • Amplitude is the variance (15S-15N; all longitudes) of eastward wavenumbers 1-6 20-100 day anomalies (Hendon et al. 1999)
Does the MJO exhibit regimes of high and low activity? MJO Occurrences (1958-2004) SK • Low-Frequency diagram • Consider XT, T=1, 3431 pentads, XT=1 event, XT= 0 no event • Define moving window SK and compute percentage of MJO events in SK: PK,T = MK,T / N where MK,T is number of events and N total number of events • Similar for summer: PSK,T = MSK,T / NS where MSK,T is number of summer events and NS total number of summer events • Similar for winter: PWK,T = MWK,T / NW where MWK,T is number of winter events and NW total number of winter events • SK odd number and varied from smallest (1 pentad) to largest possible (3431 pentads)
Hypothetical Case: events evenly spaced in time SK Low-frequency diagram Cone of Influence Cone of Influence
Overall Mean MJO Low-frequency Variability Mean PK,T Mean PSK,T Mean PWK,T SK = 145 to 657 (1.98 to 9 years) Summer Winter
Are regime changes different than random occurrences? 1% of time series with random events correlated with observed at 0.7 or higher (~50% or more of the observed variance in the mean LF MJO variability) • Monte Carlo simulations • Summer • XT, XT=1 summer event, XT= 0 no event • Randomize seasons 999 times • Each batch: • compute LF diagram • mean RSK,T (SK =145 to 657 (1.98 to 9 years) • correlation PSK,T and RSK,T • Frequency distribution of correlation > Cr • Same for winter
Summary and Conclusions • MJO exhibits substantial changes in regimes longer than interannual • Two regimes of high activity (1974-1978, 1988-1992), and low activity (1981-1986). • Markedly different changes in summer and winter activity • Summer: increased from early 1960’s to mid 1970’s and decreased steadily until the 1990’s • Winter: more regular changes with peaks in 1967, 1976 and 1989 and lows in 1971, 1983 and 1997. • Changes in summer and winter MJO activity are statistically different from random occurrences • There are positive linear trends in (1958-2004): • U200 amplitudes of summer and winter MJO events • Number of summer MJO events • Linear trends are not higher than random occurrences (5% level) • Trends in U200 amplitudes of the MJO are consistent between EOF metric (this study) and equatorial zonal mean intraseasonal index (Slingo et. 1999)
No-sat Sat Slingo et al. (1999) Intraseasonal Index (QJRMS) • Interannual variations in the MJO; NCEP/NCAR 1958-1997 • Zonal mean of U 200hPa (10°S - 10°N) • 20-100 day anomalies; square and apply 100 day smoothing • 40-yr integration of HadAM2a model driven with observed SST reproduced general trends in “MJO activity” • Index contains up to 40%unrelated MJO variability (Hendon et al. 1999)