Download
1 / 33
330 likes | 340 Views
Explore the reasons for concern about global warming and its impact on energy security. Learn about the range of predicted temperatures and the risks they pose. Consider difficult choices in electricity generation and the need for renewable options.

E N D
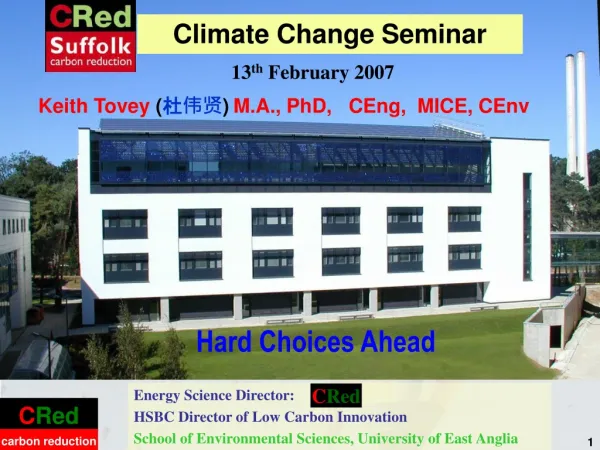
WI Meeting UEA 6th July 2005 Global Warming Energy Security Hard Choices Ahead • Keith Tovey M.A., PhD, CEng, MICE • Energy Science Director: Low Carbon InnovationCentre • School of Environmental Sciences CRed
Reasons for Concern Range of predicted temperatures Risks to Many Large Increase Net Negative for all marketsmost Negative for most Regions Higher Risk oC Some positive/ some negative Most people adversely affected Current temperature Risks to Some Negative for some Regions Increase Very Low Risk Historic Average Average 1950 - 1970 I II III IV V I Risks to Unique and Threatened Systems II Risks from Extreme Climatic Events III Distribution of Impacts IV Aggregate Impacts V Risks from Future Large Scale Discontinuities
Change in precipitation 1961-2001 Source: Tim Osborne, CRU Total summer precipitation Total winter precipitation
1.0 0.5 0.0 -0.5 1.0 0.5 0.0 -0.5 1.0 0.5 0.0 -0.5 actual Is Global Warming man made? predicted Temperature Rise (oC) 1860 1880 1900 1920 1940 1960 1980 2000 actual predicted Temperature Rise (oC) 1860 1880 1900 1920 1940 1960 1980 2000 actual predicted Temperature Rise (oC) 1860 1880 1900 1920 1940 1960 1980 2000 Prediction: Natural only good match until 1960 Prediction: Anthropogenic only Not a good match between 1920 and 1970 • Predictions include: • Greenhouse Gas emissions • Sulphates and ozone • Solar and volcanic activity Prediction: Natural and Anthropogenic Generally a good match Source: Hadley Centre, The Met.Office
2003 1979 Climate ChangeArctic meltdown 1979 - 2003 • Summer ice coverage of Arctic Polar Region • Nasa satellite imagery • 20% reduction in 24 years Source: Nasa http://www.nasa.gov/centers/goddard/news/topstory/2003/1023esuice.html
Difficult Choices Ahead Options for Electricity Generation in 2020 - Non-Renewable Methods
Options for Electricity Generation in 2020 - Renewable • Transport Fuels: • Biodiesel? • Bioethanol?
Solar Energy - The BroadSol Project Solar Collectors installed 27th January 2004 Annual Solar Gain 910 kWh
It is all very well for South East, but what about the North? House in Lerwick, Shetland Isles - less than 15,000 people live north of this in UK!
Our Choices: They are difficult • Do we want to exploit available renewables i.e onshore/offshore wind and biomass. Photovoltaics, tidal, wave are not options for next 20 years. • If our answer is NO • Do we want to see a renewal of nuclear power • Are we happy on this and the other attendant risks? • If our answer is NO • Do we want to return to using coal? • then carbon dioxide emissions will rise significantly • unless we can develop carbon sequestration within 10 years which is unlikely If our answer to coal is NO Do we want to leave things are they are and see continued exploitation of gas for both heating and electricity generation? >>>>>>
Our Choices: They are difficult • If our answer is YES • By 2020 • we will be dependent on around 70% of our heating and electricity from GAS • imported from countries like Russia, Iran, Iraq, Libya, Algeria • Are we happy with this prospect? >>>>>> • If not: • We need even more substantial cuts in energy use. • Or are we prepared to sacrifice our future to effects of Global Warming? - the North Norfolk Coal Field? Do we wish to reconsider our stance on renewables? Inaction or delays in decision making will lead us down the GAS option route and all the attendantSecurity issues that raises.
Electricity Options for the Future The Gas Scenario Assumes all new non-renewable generation is from gas. Replacements for ageing plant Additions to deal with demand changes Scenarios (1) - 7.5% renewables by 2010 15% by 2020 Scenarios (2) 10.4% by 2010 20% by 2020 • High Growth – Business as Usual • Low Growth capped at 420 TWH by 2010 • Rise in emissions 2005 – 2010 • loss of nuclear generating capacity • Fall in 2010 – 2020 • loss of nuclear and coal capacity • Little new generating capacity available before 2010 except Wind
Electricity Options for the Future • Low Growth Scenario • Capped at 420 TWh • Represents a cumulative 1.5% per annum per household reduction below historic trend • 33% CO2 reduction (Gas) cf 1990 • 62% CO2 reduction (Nuclear) cf 1990 • 68 % increase in gas consumption • ( Gas Scenario) cf 2002 • High Growth Scenario • Business as Usual • 0.3 % CO2 reduction (Gas) cf 1990 • 54% CO2 reduction (Nuclear) cf 1990 • 257% increase in gas consumption • ( Gas Scenario) cf 2002
Our Choices: They are difficult A diverse renewable supply will be local, and will be less prone to cascade power cuts such as those recently in US, London, Italy, Denmark. Conventional generation is based on large units: 500 – 660 MW enough to supply over 1 million homes. These do fail from time to time, and require much greater backup than required for the failure of a few wind turbines. Renewable generation is less prone to major interruption We must not get drawn into a single issue debate – a rational debate covering all the alternatives is needed. Available Renewables: Nuclear: Conservation
Our Choices: They are difficult • NETA has to cope with the loss of Sizewell B through a reactor trip. This loss amounts to around 1.5 times the total installed capacity of wind at present. • NETA also has to cope with sudden changes in demand (up to 2.5 times Sizewell B) in a matter of minutes e.g. from TV scheduling. • Experience from Denmark shows that the normal maximum change in any one hour from Wind Output is no more than 18% on one occasion in a year. With a larger country area the figures for diverse wind generation will be less in UK. Renewable Energy: The Issues Isn’t Energy from Renewables unreliable? – we need secure supply • One will not save Carbon Dioxide because power stations are running in case they are needed. • There is very little truth in this. The amount of carbon dioxide emitted is dependant on the output of a fossil fuel power station. If it is running under low load it will emit only a very small amount of extra CO2. • Allowing for this, the effect of standby reserve will amount to a maximum of 15 – 20 gms per kWh of Wind Energy compared to 430 for gas or 1000 for coal. • A substantial saving is made.
Our Choices: They are difficult • Affect House Prices • Evidence from Estate Agents in the Swaffham Area say they have a positive effect on house prices. Whilst the wind turbine is considered 'ugly' by some residents of Swaffham, most consider it a unique landmark and see it as an asset to the town. Most of the local population are proud of the turbine and it seems to have had a positive impact on the town in a number of ways. I do believe that were it not for the number of visitors to Swaffham, coming to see the turbine for whatever reason, we would not have such a high influx of buyers from out of the area.This has increased house prices, and the prosperity of the area.
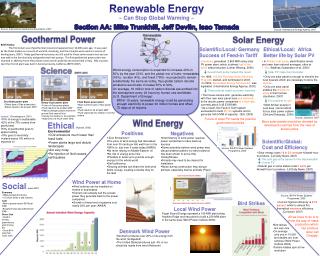
Our Choices: They are difficult Wind Turbines are Incredibly Inefficient • Efficiency: • the ratio of the USEFUL work to the total energy available (or expended) • Oxford English Dictionary Modern Wind Turbines convert 40 – 42%% of available energy in the wind Modern Coal Fired Power Stations achieve 38% Sizewell B achieves 32% A car engine achieve 30% at best Compared to many other energy devices, Wind Turbines are Very Efficient
Our Choices: They are difficult - Myths Are those who say that Wind Turbines are inefficient really meaning that they have a low load factor. Definition: production (or consumption) as a proportion of rated output (consumption). • UK wind turbines have a much higher load factor than German, Danish and Spanish because of much higher wind speeds • 27% but likely to increase with offshore turbines A car driven 10 000 miles a year has a load factor of 1 – 3% Less than one tenth of a wind turbine
Our Choices: They are difficult - Myths • Latest some evidence to suggest that a few birds are killed typically 3 per installed MW per year except in a few locations. • the oldest wind farm in UK on Burgar Hill has an RSPB reserve right next to it. • in Orkney a party from UEA came across new fewer than 3 dead birds on roads in 2 days in area around turbines. • Currently UK has around 850 MW installed perhaps 2500 killed a year • Estimates of 1 million killed each year by vehicles • British Trust for Ornithology estimate 100 million birds collide with fixed objects of whom one third are killed Wind Energy: The Issues Wind Turbines kill birds
Our Choices: They are difficult • Wind Turbines are beautiful! • Wind Turbines are Ugly! • What is the consequence of not using wind alongside conservation, biomass etc?. • Insecure supply of Electricity when we import fossil fuels from Russia • The North Norfolk Coal Field • Increased Famine • 20 new nuclear power stations in the UK by 2025 • Increased incidence of extreme weather events.
Government Response • Energy White Paper – aspiration for 60% cut in CO2 emissions by 2050 • Will require unprecedented partnership activity in local communities to ensure on track by 2020s • (– but no indication of how this will be undertaken) “There will be much more localgeneration, in part from medium to small local/community power plant, fuelled by locally grown biomass, from locally generatedwaste, and from local wind sources. These will feed local distributed networks, which can sell excess capacity into the grid.’’ - Energy White Paper: February 2003
The CRed ambition • To engage, enthuse and empower a large, diverse community to debate, plan and execute a programme to reduce carbon emissions by up to 60% by 2025 • Can a local community take on the responsibility for starting to confront the challenge of climate change and make a difference? • Or will it continue to be - someone/somewhere else? • Can we encourage politicians/officials to be bolder on our behalf? • It will involve an integrated approach to use of renewables alongside conservation “exemplar for the world”
On average each person in UK causes the emission of 9 tonnes of CO2 each year. How many people know what 9 tonnes of CO2 looks like? 5 hot air balloons per person per year. 900 000 party balloons each year "Nobody made a greater mistake than he who did nothing because he could do only a little." Edmund Burke (1727 – 1797)
Some facts: • A mobile phone charger left on even when not charging • up to 20 kg CO2 a year (200 party balloons) • Standby on television > 60 kg per year • Filling up with petrol (~£35 for a full tank) • --------- 90 kg of CO2 (5% of one hot air balloon ) • How far does one have to drive in a small family car (e.g. 1300 cc Toyota Corolla) to emit as much carbon dioxide as heating an old persons room for1 hour? • 1.6 miles or 25 party balloons
Involve the local Community • Many residents on island of Burray (Orkney) compaigned for a wind turbine. • On average they are fully self-sufficient in electricity needs and indeed are a net exporter of electricity
Electricity Statistics: North Norfolk • Each house in North Norfolk consumes, on average 5668 kWh per year 50% more than a house in Norwich • North Norfolk consumes a total of 559 million kWh per year (288 million domestic). • A wind farm the size of Scroby Sands would supply 55% of domestic needs for whole of North Norfolk (or 28% of total demand) • Would save ~ 80 000 tonnes of carbon dioxide a year or 45 000 hot air balloons each year. • The alternative: • Persuade 32 000 motorists never to drive the car again • Or320 000 motorists to drive 1000 miles less each year.
Some Media Articles might be counter productive Saturday 28th May 2005 If this statement were true then a mini would do 16944 miles per litre or 77000 miles per gallon
Hard Choices • What could the Women’s Institute do as an organisation? • What can you do individually at home? • Visit the CRed WEB Site www.cred-uk.org • Sign a pledge to • combat global warming • help secure energy supplies for the future • saving energy • promoting appropriate renewable energy
Conclusions • Global Warming will affect us all - in next few decades • Energy Security will become increasingly important. Inaction over making difficult decisions now will make Energy Security more likely in future. • Move towards energy conservation and LOCAL generation of energy It is as much about the individual’s response to use of energy as any technical measures the Government may take. • Wind (and possibly biomass) are the only real alternatives for renewable generation in next 5 – 10 years. • Otherwise Nuclear??? • Even if we are not convinced about Global Warming – Energy Security issues will shortly start to affect us.
WEBSITE www.cred-uk.org/ Conclusions • Need to act now otherwise we might have to make choice of whether we drive 1.6 miles or heat an old person’s room This presentation is available at www2.env.uea.ac.uk/cred/creduea.htm Are you up to the Challenge?: Will you make a pledge?