Download
1 / 44
440 likes | 749 Views
PROGRESS MONITORING with the. Gale H. Roid, PhD and Mark F. Ledbetter, PsyD. Outline of Workshop. Why progress monitoring? Review of newest IDEA and RTI criteria CBM/DIBELS versus improved models WRAT4-PMV: Design, administration, scoring, research, uses Case studies

E N D
PROGRESS MONITORINGwith the Gale H. Roid, PhD and Mark F. Ledbetter, PsyD
Outline of Workshop • Why progress monitoring? • Review of newest IDEA and RTI criteria • CBM/DIBELS versus improved models • WRAT4-PMV: Design, administration, scoring, research, uses • Case studies • Recommended applications
Why Progress Monitoring? • Early failure in reading ripples through upper grades and other curriculum areas • New Individuals with Disabilities Education Act (IDEA) and No Child Left Behind Act (NCLB) guidelines suggest progress monitoring within the response to intervention (RTI) model • National Assessment of Educational Progress (NAEP) shows 37% of fourth graders are below basic level in reading skills
Benefits of Intervention with Progress Monitoring • Two types of problem readers1 • Good oral language; poor phonic skills • Lower socioeconomic status (SES) with broad weaknesses • Two third graders from the northwest given intensive tutoring with frequent brief tests • Daron—Primary to Grade 3 oral reading in 14 months • Mia—Grade 1 to Grade 3 in 13 months 1Torgesen, J. K. (2004, Fall). Preventing early reading failure—and its devastating downward spiral. American Educator, 28.
Progress Monitoring in NCLB, RTI, and IDEA • Annual yearly progress (AYP) in special education • Monitoring changes in classroom instruction (Tier 2 of RTI) • Intensive assessment in Tier 3 for possible special education
History of theRTI Model According to Heller, Holtzman, and Messick (1982),2 there are three criteria for judging the validity of special education placements:3 • General education classroom OK? • Special education more effective? • Is assessment method accurate? 2 Heller, K. A., Holtzman, W. H., & Messick, S. (Eds.) (1982). Placing children in special education: A strategy for equity. Washington, DC: National Academy Press. 3 Fuchs, L. S., & Vaughn, S. R. (2006, March). Response to intervention as a framework for the identification of learning disabilities. NASP Communiqué, 34, 1-6.
History of theRTI Model (cont.) Three-phase adaptation of Heller et al.’s plan:4 • Student’s rate of growth in general education • Low-performing student’s response to better instruction • Intensive assessment and further response to evidence-based instruction 4 Fuchs, L. S., & Fuchs, D. (1998). Treatment validity: A unifying concept for reconceptualizing the identification of learning disabilities. Learning Disabilities Research and Practice, 13, 204-219.
History of theRTI Model (cont.) Three-tiered prevention model5,6,7 • Tier 1: Screening in general education • Tier 2: Fixed duration remediation with progress monitoring • Tier 3: Assessment for special education using progress monitoring 5 Individuals with Disabilities Education Improvement Act of 2004 (IDEA) (2004). Public Law No. 108-446, §632, 118 Stat. 2744. 6 Vaughn, S., Linan-Thompson, S., & Hickman, P. (2003). Response to instruction as a means of identifying students with reading/learning disabilities. Exceptional Children, 69, 391-409. 7 Gresham, F. M. (2002). Responsiveness to intervention: An alternative approach to the identification of learning disabilities. In R. Bradley, L. Danielson, & D. P. Hallahan (Eds.), Identification of learning disabilities: Research to practice (pp. 467-519). Mahwah, NJ: Erlbaum.
CBM and DIBELS • 1975: Stanley Deno (University of Minnesota) develops easy-to-use basic skills assessments for teachers • 1976 to 2005: Deno’s grad students Lynn Fuchs (Vanderbilt), Gerald Tindal (Univ. of Oregon), Mark Shinn, and others continue development of curriculum-based measurement (CBM); major federal grant support • 1998: Roland Good’s Dynamic Indicators of Basic Early Literacy Skills (DIBELS) • 2004: IDEA reauthorization recommends CBM(see http://IDEA.ed.gov)
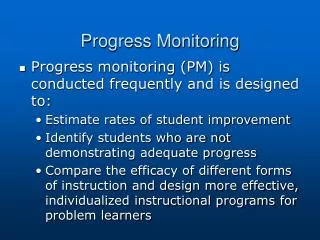
Attributes of the “Best CBM”4 • Easy-to-use individual or small group tests that teachers understand • Measures improvement over time • Brief tests given frequently • Assesses program effectiveness • No progress changes in instruction
Attributes of the “Best CBM”(cont.)8,9 • Word reading performance is highly related to other CBM measures (e.g., fluency, comprehension), especially in Grades 1-3 • Feedback to teachers and students is not enough. Guidance and follow-up on methods of reading instruction is necessary. 8 Hosp, M. K., & Fuchs, L. S. (2005). Using CBM as an indicator of decoding, word reading, and comprehension: Do the relations change with grade? School Psychology Review, 34, 9-26. 9 Graney, S. B., & Shinn, M. R. (2005). Effects of reading curriculum-based measurement (R-CBM) teacher feedback in general education classrooms. School Psychology Review, 34, 184-201.
Limitations of Some CBM Applications • Criterion-referenced CBM may not have grade-based expectations (norms) • CBM test forms not always “equivalent” statistically (variation in difficulty) • Scores not always good for program effectiveness or across-grade comparisons • Available CBM tests not in upper grades
WRAT4-PMVFeatures and Benefits • Simple and easy to use • Long tradition in special education • Four subtests: Word Reading, Sentence Comprehension, Spelling, and Math Computation • Allows dual comparisons • Rate of growth of the student • National norms for grade-level expectations
WRAT4-PMVFeatures and Benefits (cont.) • Four equivalent test forms containing 15 items at each level (six levels) • Covers Grades K-12 and college • Across-grade Level Equivalent (LE) scores are available • Computer scoring program is available
Design of WRAT4-PMV • Four forms for each level • Four subtests: Word Reading, Sentence Comprehension, Spelling, and Math Computation • Six levels - Level 1: Grades K-1 - Level 2: Grades 2-3 - Level 3: Grades 4-5 - Level 4: Grades 6-8 - Level 5: Grades 9-12 - Level 6: Grades 13-16 (i.e., college)
Test Administration:Word Reading • Start at the grade level, then adjust (out-of-level testing is OK) • Present card with letters and words • Say, “Look….read across.” • If not clear, say “Please say the word again.”
Test Administration:Sentence Comprehension • “Find the missing word.” • Present the sample card and see if the student finds the missing word • Read the other sample sentences • Student silently reads the remaining sentences in the subtest
Test Administration:Sentence Comprehension (cont.) Mark and score responses
Test Administration:Spelling • Spell the word “in context” • Write (or print) letters or words • You read the word by itself, then read the word in a sentence • Student uses Response Booklet to write responses
Test Administration:Math Computation • Oral math for Grades K-5 (Levels 1-3):“Show me 3 fingers.” • Math calculation problems Level 1: 7 or 8 items Level 2: 10 or 11 items Level 3: 13 items Levels 4-6: 15 items • Student uses Response Booklet • No calculators
Sample Examiner Instructions: Math Computation Card, Level 2 (Grades 2-3)
Technical Aspects: Reliability • High level of reliability in Grades K-12 • Test-retest 30- day practice effect = less than .5 point
Technical Aspects: Test Form Equivalence • Nearly perfect equivalence among the four test forms at all levels • Gulliksen method10 with Wilks’ Lambda11 • 10Gulliksen, H. (1950). Theory of mental tests. New York: Wiley. • 11Wilks, S. S. (1932). Certain generalizations in the analysis of variance. Biometrika, 24, 471-494.
Technical Aspects: Word Reading and LD • Study of 30 students with reading learning disability (LD) • SD difference in scores of LD versus controls = .5-1.00 (usually 2 raw score points)
Dual Criteria for LDs Look for two trends:4 • Shows no improvement—a “flat profile” based on “slope” of the graph line • Performs below grade level despite classroom interventions—the graph line stays below the grade norms
Applications ofthe WRAT4-PMV • Monitoring students identified by NCLB • Measuring RTI in Tier 2 (fixed duration remediation) • Verification of qualification for special education (Tier 3) • Long-term progress monitoring in special education (AYP)
Applications of the WRAT4-PMV (cont.) • See reference list handout for examples of empirically-based instructional interventions • Five methods of reading intervention12 - Repeated reading: Read passage twice - Listening passage preview: You read it, have student follow with finger - Phrase drill: Read error words, student repeats three times - Syllable segmentation: Read each syllable - Reward Contingency: If score is improved 12 Daly, E. J., Persampieri, M., McCurdy, M., & Gortmaker, V. (2005). Generating reading interventions through experimental analysis of academic skills: Demonstration and empirical evaluation. School Psychology Review, 34, 395-414.
For More Information… See sample materialsafter workshop. Visitwww.parinc.comand click on Assessment Consultants to contact a sales representative or to arrange a workshop in your school district.