Radiocarbon 9/30/10
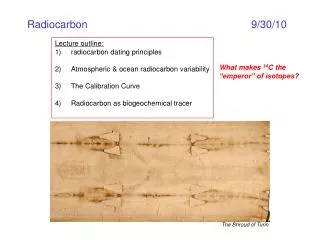
Radiocarbon 9/30/10. Lecture outline: radiocarbon dating principles Atmospheric & ocean radiocarbon variability The Calibration Curve Radiocarbon as biogeochemical tracer. What makes 14 C the “emperor” of isotopes?. The Shroud of Turin. Radiocarbon ( 14 C) formation and decay .

Radiocarbon 9/30/10
E N D
Presentation Transcript
Radiocarbon 9/30/10 • Lecture outline: • radiocarbon dating principles • Atmospheric & ocean radiocarbon variability • The Calibration Curve • Radiocarbon as biogeochemical tracer What makes 14C the “emperor” of isotopes? The Shroud of Turin
Radiocarbon (14C) formation and decay -formed by interaction of cosmic ray spallation products with stable N gas -radiocarbon subsequently decays by β- decay back to 14N with a half-life of 5730y Radiocarbon dating was first explored by W.R. Libby (1946), who later won the Nobel Prize. Most published dates still use the “Libby” half-life of 5568y to enable comparison of 14C dates. The activity of radiocarbon in the atmosphere represents a balance of its production, its decay, and its uptake by the biosphere, weathering, etc. Which of these three things might change through time, and why?
Radiocarbon Dating 1) As plants uptake C through photosynthesis, they take on the 14C activity of the atmosphere. 2) Anything that derives from this C will also have atmospheric 14C activity (including you and I). 3) If something stops actively exchanging C (it dies, is buried, etc), that 14C begins to decay. where present-day, pre-bomb, 14C activity = 13.56dpm/g C • So all you need to know to calculate • an age is A0, which to first order • is 13.56dpm/g, BUT • *small variations (several percent) • in atmospheric 14C in the past • lead to dating errors of up to 20%! • Sources of variability: • geomagnetic field strength • solar activity • carbon cycle changes
Radiocarbon Measurements and Reporting 1) Radiocarbon dates are determined by measuring the ratio of 14C to 12C in a sample, relative to a standard, usually in an accelerator mass spectrometer. standard = oxalic acid that represents activity of 1890 wood 14C ages are reported as “14C years BP”, where BP is 1950 2) Fact: Most living things do not uptake C in atmospheric ratios – i.e. they fractionate carbon, (lighter 12C preferentially used), must correct for this fractionation because it affects the 14C/12C ratio Researchers collect the 13C/12C ratio, use it to correct for “missing” 14C So the less 13C a sample has, the less 14C it has, and so the uncorrected 14C age will be _______ than the calendar age? Samples are “normalized” to a d13CPDB value of -25‰ 3) The final step is to obtain a “calibrated 14C age” using the atmospheric radiocarbon content when the sample grew.
Atmospheric radiocarbon variability through time Convention: The atmospheric radiocarbon anomaly with respect to a standard is defined as D14C • solar activity changes Note: the D14C is 0 during 1890, b/c that’s the activity of the oxalic acid standard • addition of isotopically light • fossil fuel C to atmosphere time But how did somebody construct this curve?
Reconstructing atmospheric radiocarbon variability through time What you need: absolute age & radiocarbon age What you get: history of 14Catmos radiocarbon sampling transect tree cut in 1999A.D. 1821A.D. by ring-counting Most of the Holocene 14Catmos variability derives from changes in the geomagnetic field
Over longer timescales, what’s controlling atmospheric Δ14C? Earth’s Carbon Reservoirs 14C content (in Gigatons C): atmosphere 748 highest (site of production) terrestrial 2,000 high (some old organic matter) oceanic 38,000 high (surface) and low (deep) geologic 4,000 zero (isolated from atmos. for long time) • Climate changes perturb the E’s carbon • cycle (and therefore 14Catmos) by: • changing the amount of C stored on land • (ex ice sheets of LGM) • -changing the ability of the deep • ocean to sequester old carbon from • atmosphere (ex increased stratification)
The ocean “conveyor belt” and radiocarbon Seawater radiocarbon measurements set a time-scale for whole-ocean mixing (~1500y), and identified the locations where deep-mixing occur The 14C ages of waters along a N-S transect in the Atlantic. the youngest waters are at the surface and in the deep North Atlantic note non-zero age at surface the “bomb” spike the oldest waters are in the mid-depth pacifc (age~1500y) 14C measurements from vertical profiles taken in world’s oceans 4) If dating a marine sample, you will need to correct its calibrated 14C age with a reservoir age, which ranges from <100yrs in the stagnant subtropical gyres to >1000yrs in the mid-depth Pacific.
Paleo-ventilation ages from 14C in marine carbonates 1. compare 14C ages of benthic and planktonic forams in same core horizon 2. compare U-series and 14C ages for deep-sea corals Atlantic Pacific, LGM=large symbols GEOSECS=small dots 100y of growth (study modern corals) diff. in 14C ages=670y! Adkins et al., 1998 Broecker et al., 2004
The Radiocarbon Calibration Curve (atmospheric 14C history) Principle: compare radiocarbon dates with independent dates examples of independent dating: tree-ring counting, coral U-Th dates, varve counting, correlation of climate signals in varves with ice core Observation: radiocarbon dates are consistently younger than calendar ages data from: corals (bright red) lake varves (green) marine varves (blue) speleothems (orange) tree rings (black) So was atmospheric 14C larger or smaller at 20k (LGM) than today? equiline time Hughen et al., 2004
red=observed 14C black=modelled 14C But what caused these large changes in atmospheric 14C? Use a carbon cycle model that includes radiocarbon, play with different scenarios, check fit with reality. geomagnetic field from paleomag studies only geomagnetic field from paleomag + magnetic anomaly at 44k geomagnetic field + mag. anomaly + reduced sedimentation during glacial + change in overturning circulation geomagnetic field + mag. anomaly + reduced sedimentation during glacial stop transferring radiocarbon into deep ocean Beck et al., 2001
So what is the average geochemist to do? Trust the experts! INTCAL98 – established one curve to use for 14C calibration: Stuiver, M., Reimer, P.J., Bard, E., Beck, J.W., Burr, G.S., Hughen, K.A., Kromer, B., McCormac, G., van der Plicht, J., & Spurk, M. 1998. INTCAL98 Radiocarbon Age Calibration, 24,000-0 cal BP. Radiocarbon 40(3):1041-1084. Use their calibration program (current version = CALIB 6.0): http://radiocarbon.pa.qub.ac.uk/calib M. Stuiver, P.J. Reimer, and R. Reimer Also, avoid contamination with post-bomb/tracer carbon at all costs! Ex: diagenesis may replace original C with post-bomb (modern) C or contamination with tracer (super-enriched) 14C used by biologists (next lecture)
The timing and structure of the “bomb” spike Bomb-produced radionuclides (in 1018 Bq (1Bq=1dps) * * * *
The radiocarbon bomb spike – atmosphere vs. other reservoirs +1000‰ = 14C doubles Trumbore, 2000 Source of bomb 14C: stratosphere, Northern Hemisphere Incorporation of bomb 14C into various C reservoirs depends on the residence time of C in that reservoir Ex: short residence time = quick, high-amplitude response long residence time = delayed, low-amplitude response Why?
Seawater radiocarbon observations • GEOSECS – Geochemical Ocean • Section Study • 1972-1978 • transects through all major oceans • WOCE – World Ocean Circulation • Experiment • 1990-2002 • extensive coverage of the ocean
Ocean models of bomb 14C Can ocean general circulation models accurately capture the spatial and temporal evolution of the bomb radiocarbon spike? *Our understanding of ocean mixing (esp. vertical mixing) is extremely limited, 14C can help. Rodgers et al., 1999
Model D14C-coral D14C comparisons French Frigate Shoals Fiji Rodgers et al., 1999 Why are some records “smoother” than others (ie Galapagos vs. Fiji)? Nauru Galapagos
Radiocarbon in the Biosphere Approach: Use bomb 14C as a tracer of carbon cycling in complex environments. Or use natural level 14C to date carbon in various pools. Gaudinski et al., 2000
Radiocarbon measurements of carbon cycling in the ocean dissolved inorganic carbon contains bomb 14C at surface, not at deep dissolved organic carbon old – highly refractory sinking particulate organic matter contains bomb carbon Figure 1. Radiocarbon in different reservoirs of carbon at Station M in the North Eastern Pacific Ocean. Red circles represent values for HMW DOM (Aluwihare, 1999); blue bars at 0 m and 1500 m represent the range of values observed for individual monosaccharides isolated from HMW sugars (Aluwihare, 1999). DIC, total DOC, and POC data are from Druffel et al., 1996 and Bauer et al., 1998.
Atmosphere-Ocean-Biosphere models of bomb 14C evolution The contributions of ocean, terrestrial biosphere, fossil fuel combustion and bomb testing to atmospheric D14C was investigated with an Atmospheric General Circulation Model (GCM) coupled to a carbon cycle model. Atmosphere Terrestrial biosphere w/ three different carbon residence times Why does the terrestrial biosphere lag the atmosphere? The detrended atmos D14C, showing large seasonal cycle Randerson et al., Global Biogeochemical Cycles, 2002 Why do Southern and Northern Hemisphere D14C values differ in 1970?