Download
1 / 6
60 likes | 196 Views
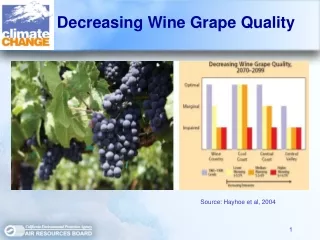
Predicting White Wine Quality Scores. Raphael Mwangi. Background. Tree-models are intuitive, easy to understand, and can be used as tools for more advanced algorithms to create highly accurate models Tree-modeling requires practically no knowledge of statistics to understand. =3898 =5.87.

E N D
Predicting White Wine Quality Scores Raphael Mwangi
Background • Tree-models are intuitive, easy to understand, and can be used as tools for more advanced algorithms to create highly accurate models • Tree-modeling requires practically no knowledge of statistics to understand
=3898 =5.87 Basic Example If Alcohol > 10.85 If Alcohol < 10.85 =1433 =6.345 =2465 =5.596 • Terminology: • “Node” – denoted ,a circle in which observations are grouped into by a particular If Then statement • “” = the number of observations in the node “” • = the average wine quality score of the N observations in the node “”.
Bagging • Bagging • Take a large number of samples, “B”, of size n from your dataset, with replacement (bootstrap samples) • Fit a tree model to each bootstrap sample. • When making predictions of y for specific values of x, average from your “B” bootstrap samples for a more accurate prediction
Results of Single Tree Model vs. Bagged Tree Model • Each prediction we make will, on average, be: • 0.77 points off from the true wine quality score for the Single Tree Model • 0.75 points off from the true wine quality score for the Bagged Tree Model • Bagged model did slightly better