6.7
6.7. Use Measures of Central Tendency. Compare measures of central tendency. Example 1. Temperature The daily February temperatures (in degrees Fahrenheit) for 10 days are listed for a certain city. Find the mean, median, and mode(s) of the data. 20, 21, 22, 24, 25, 26, 27, 29, 37, 37.

6.7
E N D
Presentation Transcript
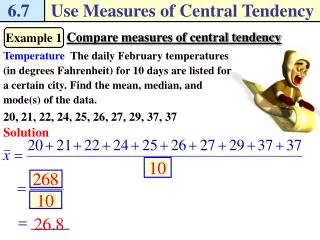
6.7 Use Measures of Central Tendency Compare measures of central tendency Example 1 Temperature The daily February temperatures (in degrees Fahrenheit) for 10 days are listed for a certain city. Find the mean, median, and mode(s) of the data. 20, 21, 22, 24, 25, 26, 27, 29, 37, 37 Solution
6.7 Use Measures of Central Tendency Compare measures of central tendency Example 1 Temperature The daily February temperatures (in degrees Fahrenheit) for 10 days are listed for a certain city. Find the mean, median, and mode(s) of the data. 20, 21, 22, 24, 25, 26, 27, 29, 37, 37 Solution The median is the mean of the two middle values, ______. The mode is ______. The ______ and ________ best represent the data. mean median
6.7 Use Measures of Central Tendency Checkpoint. Complete the following exercises. • Find (a) the mean, (b) the median, and (c) the mode(s) of the data set. 67, 70, 73, 73, 78, 80
6.7 Use Measures of Central Tendency Compare measures of dispersion Example 2 Running The top 4 finishing times (in seconds) for two different teams in the 50 meter dash are given. Compare the spread of the data for the two sets using (a) the range and (b) the mean absolute deviation. Team A: 5.8, 6.0, 6.2, 6.4 Team B: 5.7, 5.9, 6.5, 6.7 Solution • Team A: ____ - _____ = _____ 6.4 0.6 5.8 Team B: ____ - _____ = _____ 6.7 1 5.7 The range for Team ___ is greater than the range for Team ___, so the data for Team ___ cover a wider interval than the data for Team ___. B A B A
6.7 Use Measures of Central Tendency Compare measures of dispersion Example 2 Running The top 4 finishing times (in seconds) for two different teams in the 50 meter dash are given. Compare the spread of the data for the two sets using (a) the range and (b) the mean absolute deviation. Team A: 5.8, 6.0, 6.2, 6.4 Team B: 5.7, 5.9, 6.5, 6.7 Solution • The mean for Team A is ____, so the mean absolute deviation is: 6.1 The mean for Team B is ____, so the mean absolute deviation is: 6.2
6.7 Use Measures of Central Tendency Compare measures of dispersion Example 2 Running The top 4 finishing times (in seconds) for two different teams in the 50 meter dash are given. Compare the spread of the data for the two sets using (a) the range and (b) the mean absolute deviation. Team A: 5.8, 6.0, 6.2, 6.4 Team B: 5.7, 5.9, 6.5, 6.7 Solution The mean absolute deviation of Team ___ is greater, so the average variation from the mean is greater for the data for Team ___ than for the data for Team ___. B B A
6.7 Use Measures of Central Tendency Checkpoint. Complete the following exercises. • In Example 2, suppose the slowest time for Team B was 6.6 seconds. Recalculate the range and mean absolute deviation. Team B: 5.7, 5.9, 6.5, 6.6 Range: = 0.9 mean is 6.175 Mean absolute deviation:
6.7 Use Measures of Central Tendency Pg. 385, 6.7 #1-19