Download
1 / 32
330 likes | 648 Views
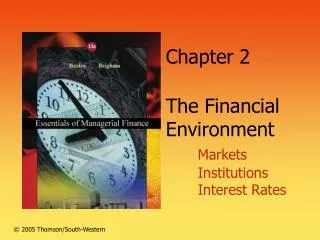
Chapter 2 The Financial Environment Markets Institutions Interest Rates. © 2005 Thomson/South-Western. The Financial Markets. Debt versus equity markets Debt markets = loans Equity markets = stocks Money versus capital markets Money market = debt < 1 year

E N D
Chapter 2The Financial EnvironmentMarkets Institutions Interest Rates © 2005 Thomson/South-Western
The Financial Markets • Debt versus equity markets • Debt markets = loans • Equity markets = stocks • Money versus capital markets • Money market = debt < 1 year • Capital market = debt > 1 year + stocks • Primary versus secondary markets • Primary markets = new funds • Secondary markets = outstanding securities
The Financial Markets • Public versus private markets • Public markets = liquid, low-cost standardized trades • Private markets = specialized deals • Spot versus futures markets • Spot markets = assets traded “on the spot” • Futures markets = for delivery at a later date • World, national, regional, and local markets • Worldwide = New York Stock Exchange • Local = Chicago Stock Exchange
Financial Institutions Funds are transferred between those who have funds and those who need funds by three processes: • Direct transfers • No intermediaries • Often part of private market transactions • Investment banking houses • I-Bank = middleman • I-Bank may buy in hopes of selling, so there is some risk • Financial intermediaries • Banks or mutual funds • Savers invest in one type of product (e.g., CDs or savings accounts) • Bank then creates loans, mortgages, etc. to sell to borrowers
Financial Intermediaries • 1993 Glass-Steagall Act • Prohibited commercial banks from I-banking activities • Tried to prohibit “conflict of interest situations” • Result: Morgan Bank • JP Morgan Chase & Company = commercial bank • Morgan Stanley = investment bank • 1999 Gramm-Leach-Bliley Act • Expanded the powers of banks • Abolished major restrictions of the Glass-Steagall Act • Allows banks to do: • I-banking • insurance sales and underwriting • low risk non-financial activities
Financial Intermediaries • The Gramm-Leach-Bliley Act blurred the distinctions: • Commercial banks • Savings and loan associations • Credit unions • Pension funds • Life insurance companies • Mutual funds
Stock Markets • Old classification • Organized Security Exchanges • NYSE, AMEX, and regional • OTC (over-the-counter markets) • A broader network of smaller dealers • New classification • Physical stock exchanges • NYSE, AMEX • Organized Investment Networks • OTC, Nasdaq, electronic communication networks (ECN)
Physical Stock Exchanges • A physical, “material entity” • A building • Designated members • A board of governors • Seats are bought and sold • Record high price = $4M (12/1/05) • Price in 1999 = $2M • Auction markets • Sell orders and buy orders come together
Organized Investment Networks • For securities not traded on physical stock exchanges • An intangible trading system • A network of brokers and dealers (NASD) • Dealers make the market • The bid price = what the dealer will pay to buy • The ask price = what the dealer will take to sell • Spread = the dealer’s profit • Electronic communications networks
The Cost of Money Four factors that affect the cost of money • Production opportunities • Is it worth investing in new assets? • Time preferences for consumption • Now or later? • Risk • How likely is it that this investment won’t pan out? • Expected inflation • How much will prices increase over time?
The Cost of Money • What do we call the price, or cost, of debt capital? The Interest Rate • What do we call the price, or cost, of equity capital? Return on Equity =Dividends + Capital Gains
Market A: Low-Risk Securities Market B:High-Risk Securities Interest Rate, kA Interest Rate, kB S1 % % S1 kB = 12 kA = 10 8 D1 D1 D2 0 0 Dollars Dollars Interest Rate Levels Interest Rates as a Function of Supply and Demand
k = any nominal rate = quoted rate kRF = Risk-free rate on T-securities “Real” versus “Nominal” Rates = real risk-free rate. k* Typically 2% to 4% T-bill for short term T-bond for long term
The Determinants of Market Interest Rates k = Quoted or nominal rate k* = Real risk-free rate (“k-star”) IP = Inflation premium DRP = Default risk premium LP = Liquidity premium MRP = Maturity risk premium
The Determinants of Market Interest Rates Quoted Interest Rate = k k = Risk-free interest rate + risk premium k = kRF + RP k = kRF + [DRP + LP + MRP] k = [k* + IP] + [DRP + LP + MRP]
The Determinants of Market Interest Rates Nominal Interest Rate = k = [k* + IP] + [DRP + LP + MRP] • IP = average rate of inflation expected in future • DRP = risk that a borrower will default on a loan (difference between the T-bond interest rate and a corporate bond with same features) • LP = premium if asset cannot be converted to cash quickly and at close to the original cost (2 – 5%) • MRP = the interest rate risk associated with longer maturity periods (usually 1 – 2%)
Determinants of Market Interest Rates Quoted Risk-Free Rate = k = kRF + DRP + LP + MRP k = Quoted or nominal rate kRF = Real risk-free rate plus a premium for expected inflation or kRF = k* + IP DRP = Default risk premium LP = Liquidity premium MRP = Maturity risk premium
Premiums Added to k* forDifferent Types of Debt IP = Inflation premium DRP = Default risk premium LP = Liquidity premium MRP = Maturity risk premium • Short-Term (S-T) Treasury: only IP for S-T inflation • Long-Term (L-T) Treasury: • IP for L-T inflation plus MRP • Short-Term corporate: Short-Term IP, DRP, LP • Long-Term corporate: IP, DRP, MRP, LP
The Term Structure of Interest Rates • Term structure: the relationship between interest rates (or yields) and maturities • A graph of the term structure is called the yield curve.
Interest Rate (%) 16 14 12 10 8 6 4 2 0 March 1980 July 2000 July 2003 1 5 10 20 Short Term Intermediate Term Long Term U.S. Treasury Bond Interest Rates on Different Dates Abnormal Interest RateTerm to March July July Maturity 1980 2000 2003 3 months 16.0% 6.1% 0.9%1 year 14.0 6.1 1.05 years 13.5 6.2 2.310 years 12.8 6.1 3.320 years 12.3 6.2 4.3 Flat = horizontal Normal
Three Explanations for the Shape of the Yield Curve • Liquidity Preference Theory • Expectations Theory • Market Segmentation Theory
Liquidity Preference Theory • Lenders prefer to make short-term loans • Less interest-rate risk • More liquid • Lenders lend short-term funds at lower rates • Says MRP > 0 • Results in “normal” curve
Expectations Theory • Shape of curve depends on investors’ expectations about future inflation rates. • If inflation is expected to increase, S-T rates will be low, L-T rates high, and vice versa. • The yield curve can slope up OR down.
Calculating Interest Rates under Expectations Theory Step 1:Find the Inflation Premium, the average expected inflation rate over years 1 to N
Example: • Inflation for Year 1 is 5%. • Inflation for Year 2 is 6%. • Inflation for Year 3 and beyond is 8%. • k* = 3% • MRPt = 0.1% (t-1) IP1 = 5%/ 1.0 = 5.00% IP10 = [ 5 + 6 + 8(8)] / 10 = 7.5% IP20 = [ 5 + 6 + 8(18)] / 20 = 7.75% Must earn these IPs to break even vs. inflation;these IPs would permit you to earn k* (before taxes).
Step 2: Find MRP based on this equation: MRPt = 0.1% (t - 1) Calculating Interest Rates under Expectations Theory: MRP1 = 0.1% x 0 = 0.0% MRP10 = 0.1% x 9 = 0.9% MRP20 = 0.1% x 19 = 1.9%
Step 3: Add the IPs and MRPs to k*: kRFt = k* + IPt + MRPt kRF = Quoted market interest rate on treasury securities. Assume k* = 3%. Calculating Interest Rates under Expectations Theory: 1-Yr: kRF1 = 3% + 5.0% + 0.0% = 8.0% 10-Yr: kRF10 = 3% + 7.5% + 0.9% = 11.4% 20-Yr: kRF20 = 3% + 7.75% + 1.9% = 12.7%
Interest Rate (%) Treasury yield curve 12.7% 15 11.4% 8.0% 10 5 Years to maturity 0 0 1 5 10 15 20 Yield Curve
Market Segmentation Theory • Borrowers and lenders have preferred maturities • Slope of yield curve depends on supply and demand for funds in both the L-T and S-T markets • Curve could be flat, upward, or downward sloping
Other Factors that Influence Interest Rate Levels • Federal Reserve Policy • Controls money supply; impacts S-T interest rates • Federal Deficits • Larger federal deficits mean higher interest rates • Foreign Trade Balance • Larger trade deficits mean higher interest rates • Business Activity • Does the Federal Reserve need to stimulate activity?
Interest Rate Levels and Stock Prices • The higher the rate of interest, the lower a firm’s profits • Interest rates affect the level of economic activity . . . which affects corporate profits • If interest rates rise . . . Investors turn to the bond market, sell stock, and decrease stock prices • If interest rates decline . . . Investors turn to the stock market, sell bonds, and increase stock prices
For Next Class: Chapter 2 Homework problems Review Chapters 1 and 2 Prepare for Chapter 1-2 quiz Read Chapter 3