Download

1 / 40
400 likes | 407 Views
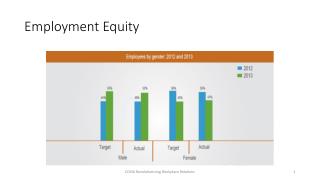
Employment Equity as an imperative to Skills supply and demand. Presentation to Bankseta 25/10/07 Jimmy Manyi. Snippets of 7 TH CEE ANNUAL REPORT 2006/2007. CONSTITUTION of RSA Chapter 2 Bill of Rights Section 9(2).

E N D
Employment Equity as an imperative to Skills supply and demand. Presentation to Bankseta 25/10/07Jimmy Manyi
CONSTITUTION of RSA Chapter 2 Bill of Rights Section 9(2) “Equality includes the full and equal enjoyment of all rights and freedom. To promote the achievement of equality, legislative and other measures designed to protect or advance persons, or categories of persons disadvantaged by unfair discrimination may be taken”
PURPOSE OF EE ACT To achieve equity in the workplace by- • Promoting equal opportunity and fair treatment in employment through elimination of unfair discrimination; and • implementing affirmative action measures to redress the disadvantages in employment experienced by designated groups to ensure their equitable representation in the workplace
DISTRIBUTION OF REPORTS RECEIVED AND ANALYZED FROM 2000 TO 2006 • 12980 reports were received and 8250 reports were analyzed in 2000; • 6990 reports were received and 6990 reports were analyzed in 2002; • 9389 reports were received and 5554 reports were analyzed in 2004; and • 6879 reports were received and 4394 reports were analyzed in 2006.
KEY REASONS FOR EXCLUDING REPORTS FROM THE ANALYSES • Data in vital tables were not tallying; • Reports not signed by the CEO; • Missing pages and inaccurate completion of certain sections; and • Reports containing in-house categories and levels that do not correlate with the regulations.
DG REVIEW –Sec 43 • No consultation with Employees. • Arbitrary reports not based on any plan. • Consultants employed to help tic the box that report has been submitted. • No EE forums, just management. • Inability to find suitable blacks
Employer Attitude or Mindset Transformation Wireless Racism Race-consciousness vs Racism Merit and AA Marginalisation---Co-opted Black apologists- 37% drop in blk training Psychological testing Unrepresentative and intimidating panels Uncustomised competency based interviews for new entrants
POPULATION DISTRIBUTION IN TERMS OF RACE & GENDER IN SA (CENSUS 2001) A total population of 44,819,777 was reported with the following distribution: • 90.4 % Blacks (43.2% male & 47.2% women) • 9.6% Whites (4.6% male & 5.0% women); and • 47.8% male & 52.2% women.
ECONOMICALLY ACTIVE POPULATION (EAP) DISTRIBUTION IN TERMS OF RACE & GENDER
EAP IN TERMS OF RACE & GENDER (LFS SEPTEMBER 2006) • 87.2 % Blacks (46.9% male & 40.3% women) • 12.8% Whites (7.3% male & 5.5% women); and • 54.2% male & 45.8% women.
ECONOMICALLY ACTIVE POPULATION • EAP of total population 100% (female 45.7%, male 54.3%) • EAP of Blacks 87.5% (female 40.2% & male 47.3%) • EAP of Africans 74.1% (female 34.3% & male 39.8) • EAP of Coloureds 10.3% (female 4.7% & male 5.6) • EAP of Indians 3.1% (female 1.2% &. Male 1.9%) • EAP of Whites 12.6% (female 5.6% &. Male 7.0%)
Suitably qualified person (Starting Point- EE Act ) • Formal qualification • Prior Learning (Formal or experience gained elsewhere) • Previous experience • Capacity to acquire competence in a reasonable time
Smokes and Mirrors • Matric pass rate, maths and science • Starting point – Institute of Race Relations -2004 • Others start in 2006 instead of early 70’s • Setas are not training enough people (FSC) • Mismatch of black graduates v/s required skills (AAC) • No soft skills
PRESENTATION FOCUS – 1ST THREE OCCUPATIONAL LEVELS • Presentation focuses on trends involving the first three upper occupational levels. • The three occupational levels are Top Management, Senior Management and Professionally Qualified & Middle Management. • This is where designated groups are most under-represented.
TOP MANAGEMENT – TOTAL % CHANGE FOR RACE FROM 2000 TO 2006 • Blacks increased by 9.5% • Africans increased by 5.1% to 11.3= need 6.5* • Coloureds increased by 2.0% to 4.7= need 2.2* • Indians increased by 2.4% to 6.2 = 2*EAP • White women incrsd by 4.5% to 14,7 = ~3*EAP
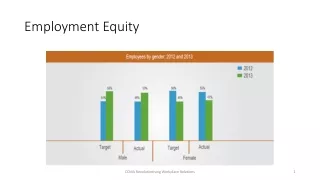
TOP MANAGEMENT – TOTAL % CHANGE FOR WOMEN FROM 2000 TO 2006 • Women increased by 9.2% • African women representation increased by 1.7% • Coloured women representation increased by 1.3% • Indian women representation increased by 1.2% • White women increased by 4.5%
SENIOR MANAGEMENT – TOTAL % CHANGE FOR RACE FROM 2000 TO 2006 • Blacks increased by 8.4% • Africans increased by 4.7% to 13.4 % • Coloureds increased by 0.9% to 5.8% • Indians increased by 2.8% to 7.0% • White women increased by 2.3% to 19% and are more three times their EAP
SENIOR MANAGEMENT – TOTAL % CHANGE FOR WOMEN FROM 2000 TO 2006 • Women increased by 6.4% • African women increased by 1.6% to 3.6% • Coloured women increased by 0.7% to 2.1% • Indian women increased by 1.4% to 2.3% • White women increased by 2.3% to 19%
PROFESSIONALLY QUALIFIED – TOTAL % CHANGE FOR RACE FROM 2000 TO 2006 • Blacks decreased by 7.6% to 36.5% • Africans decreased by 12.6% to 20.2% • Coloureds increased by 2.5% to 8% • Indians increased by 2.5% to 8.3% • Whites increased by 6.1%, to 62.2% White males increased by 26.2% and are almost twelve times their EAP
PROFESSIONALLY QUALIFIED – TOTAL % CHANGE FOR WOMEN FROM 2000 TO 2006 • Women decreased by 6.9% to 36,3% • African women decreased by 13.3% to 7.2% • Coloured women decreased by 1.2% to 3.4% • Indian women increased by 1.0% to 3.2% • White women increased by 3.8% to 22.1%
WORKFORCE PROFILE OF PEOPLE WITH DISABILITIES (PWD’S) (EE REPORTS 2006 – OCCUPATIONAL LEVELS)
% CHANGE FOR PWD’S IN EMPLOYMENT FROM 2000 TO 2006 • PWD’s workforce representation was 0.9% in 2000. • PWD’s workforce representation was 1% in 2002. • PWD’s workforce representation was 1% in 2004. • PWD’s workforce representation was 0.7% in 2006.
TOP MANAGEMENT (EE REPORTS 2006 – RECRUITMENTS) Of all recruitments at this level : • 38.9% were Black & 53.5% were White: and • 72.2% were male & 22.2% were women • 7.6% were foreign nationals
SENIOR MANAGEMENT (EE REPORTS 2006 – RECRUITMENTS) Of all recruitments at this level: • 32.8% were Black & 63.4% were White • 68.5% were male & 27.7% were women • 3.4% foreign national
PROFESSIONALLY QUALIFIED MANAGEMENT (EE REPORTS 2006 – RECRUITMENTS) • 40.8% were Black & 57.0% were White • 59.9% were male & 37.1% were women • 2.3% foreign national
RECRUITMENT (PWD’S) (EE REPORTS 2006 – OCCUPATIONAL LEVELS) Approximately 1% of all recruits were people with disabilities (PWD’S)
TOP MANAGEMENT (EE REPORTS 2006 – PROMOTION) Of all promotions at this level: 31.3% were Black & 65.7% were White 71.7% were male & 25.3% were women 3.0% were foreign national
SENIOR MANAGEMENT (EE REPORTS 2006 – PROMOTIONS) Of all promotions at this level: • 39.7% were Black & 58.8% were White • 66.8% were male & 31.7% were women • 1.7% foreign national
PROFESSIONALLY QUALIFIED (EE REPORTS 2006 – PROMOTIONS) Of all promotions at this level: • 60.8% were Black & 38.8% were White • 65.1% were male & 34.5% were women • 0.4% foreign national
PROMOTIONS (PWD’S) (EE REPORTS 2006) Approximately 0.2% of all promotions were people with disabilities (PWD’s).
Black involvement in the economy • Management of the Economy predominantly in White hands • Both line and support functions dominated by Whites • Black people are largely in support functions • Even in those support functions, Black people remain largely without authority • Pace of transformation painfully slow
TRAINING • Whites dominate in the middle to upper levels when it comes to receiving training • Generally no purposeful training • Those Blacks who receive training appear to be on perpetual training with no graduation into meaningful career paths .
ENFORCEMENT MECHANISMS • Quantum of fines is meaningless and need to be revised upwards • Remedial action to kick in sooner • Specific proposals in the 2nd half of 2007 • Inspectorate has been advised to particularly focus on the Top 100 JSE
SHOULD WHITE WOMEN continue to BE DESIGNATED ? Whereas EAP of White women is 5.5%: • 14.7% of all Top Management positions • 19% of all Senior Management positions • 22.1% of all Professionally Qualified & Middle Management positions