Download
1 / 26
260 likes | 463 Views
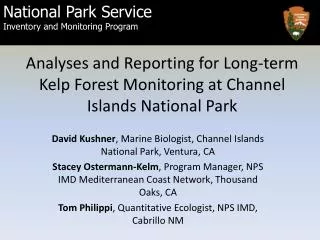
National Park Service Inventory and Monitoring Program. Analyses and Reporting for Long-term Kelp Forest Monitoring at Channel Islands National Park. David Kushner , Marine Biologist, Channel Islands National Park, Ventura, CA

E N D
National Park Service Inventory and Monitoring Program Analyses and Reporting for Long-term Kelp Forest Monitoring at Channel Islands National Park David Kushner, Marine Biologist, Channel Islands National Park, Ventura, CA Stacey Ostermann-Kelm, Program Manager, NPS IMD Mediterranean Coast Network, Thousand Oaks, CA Tom Philippi, Quantitative Ecologist, NPS IMD, Cabrillo NM
Mediterranean Coast Inventory and Monitoring Network The Issues • CHIS Prototype Park with >20 years of monitoring data • State of the Art & Pride of NPS when started • Aging data management • Substantial time requirement for annual reporting • Role for MEDN when most biologists base funded in 2 big units • Database support & modernizing • Improved reporting • Science Communication • Analysis & reporting issues looming for all I&M networks • CHIS extant data for developing analytical approaches & tools for trends • Ballpark 7 units per network and 7 vital signs per unit
Mediterranean Coast Inventory and Monitoring Network Unindicted Co-conspirators
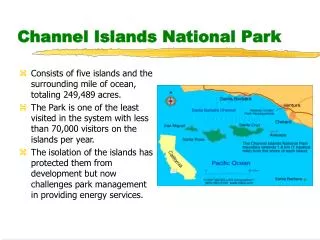
Mediterranean Coast Inventory and Monitoring Network CHIS Kelp Forest Monitoring • 5 Islands; 33 Sites • Some sites in marine preserves • Many taxa (varying abundances) • 16 species of fish • 37 invertebrate taxa • 14 algal taxa • Multiple protocol components: • Quadrats, band transects, point contact, fish counts, etc. • Complex data: • Counts, but also size distributions, point cover, etc.
Mediterranean Coast I&M Network How to Present Overviews at Multiple Scales? • Tiling to present 1 figure per island, plus 6th figure of all islands combined • If individual sites within islands, must be colors or columns within island panels, not 33 figures • Trend lines & simple control charts for quantities • Histograms, tables, & densityplots (probability distributions) for size distributions • Quantile regressions for trends over time? • Trends in species composition?
Mediterranean Coast I&M Network How to Present Overviews at Multiple Scales? • Consistency in layouts and legends • Consistent with maps if applicable • Aligned scales across panels • Data Visualization • Cleveland, Friendly, etc. • Spend time on this!
Mediterranean Coast Inventory and Monitoring Network Tools • R for analyses & graphing (& tables) • Scripting for repeating each year • SWord plugin for embedding live R objects in MS word .doc documents • Menu item to insert objects or regenerate objects Annual report template with headings, boilerplate, tables, figures, everything but the discussion / interpretation (your knowledge cannot be replaced!)
Mediterranean Coast Inventory and Monitoring Network Alternatives • MS Office • Embed Access queries, Excel charts, etc. in Word document • Chrystal Reports • Embedded or pasted into Word or InDesign document • R2wd • R-side build more appropriate for starting 200 NPScape .doc files • Sweave, LaTEX, ODF (OpenOffice) full “Reproducible Research” • www.reproducibleresearch.org
Mediterranean Coast I&M Network How to Present Overviews at Multiple Scales? • Tiling to present 1 figure per island, plus 6th figure of all islands combined • If individual sites, must be colors or columns within island panels • Emphasize patterns consistent across islands v island-specific responses • Patterns consistent across sites v site to site variability (including protected / unprotected)
Mediterranean Coast Inventory and Monitoring Network Fish Size Histograms • Species-specific size ranges, so species-specific cutpoints for binning • Some species rare enough that size distributions not meaningful at individual sites or islands • Comparisons between size distributions inside v. outside of reserves informative
Mediterranean Coast Inventory and Monitoring Network Fish Size Histograms • Lattice graphics • Panel or condition by island • Dataframe for graphics duplicated with “All Islands” pooled numbers • Boxplot() not histogram() to get horizontal bars • Species-specific cutpoints Copper rockfish 2007 Sebastescaurinus 0 2 4 6 8 All Islands Combined Anacapa (50,75] (45,50] (40,45] (35,40] (30,35] (25,30] (20,25] (15,20] (10,15] (5,10] (0,5] San Miguel Santa Barbara Length in cm (50,75] (45,50] (40,45] (35,40] (30,35] (25,30] (20,25] (15,20] (10,15] (5,10] (0,5] Santa Rosa Santa Cruz (50,75] (45,50] (40,45] (35,40] (30,35] (25,30] (20,25] (15,20] (10,15] (5,10] (0,5] 0 2 4 6 8 Count
Mediterranean Coast Inventory and Monitoring Network Fish Size Histograms • Changes across years
Mediterranean Coast Inventory and Monitoring Network Benthic Invertebrate Size Distributions • Size Distributions over time • Pool across sites, possibly islands too • Aligned densityplots or histograms • Quantiles of size distribution over time • Observed quantiles each year • fit values from quantile regression
Mediterranean Coast Inventory and Monitoring Network Pooled Size Distributions Lottia Sizes in CABR Tidepools 1990-2010 20 40 60 80 S 90 F 00 F 90 S 01 S 91 F 01 S 02 F 91 F 02 S 92 S 03 F 92 S 93 F 03 F 93 S 04 F 04 S 94 S 05 F 94 F 05 S 95 F 95 S 06 F 06 F 96 S 97 S 07 F 97 F 07 S 98 S 08 F 98 F 08 S 99 S 09 F 09 F 99 S 00 S 10 20 40 60 80 Size in mm CAB1 CAB2 CAB3
Mediterranean Coast Inventory and Monitoring Network Quantile Regression Lottia Sizes in CABR Tidepools 1990-2010 80 Quantiles 90th 60 75th Size in mm 40 Median 25th 10th 20 0 Sp 1990 Sp 1995 Sp 2000 Sp2005 F 2010 Year
Mediterranean Coast Inventory and Monitoring Network Quadrat Counts • This year’s status by site within island • Averaged across quadrats (losing within-site spatial variability) • “Historic Variability” as context for understanding current value • Boxplot of values from period of record, 5 year or 10 year, perhaps corrected means factoring in ENSO or other important covariates
Mediterranean Coast Inventory and Monitoring Network Quadrat Counts
Mediterranean Coast Inventory and Monitoring Network SWord • Free for non-commercial use • http://rcom.univie.ac.at/main.html • Uses statconDCOM, rscproxy (requires admin privileges to install) • Adds “Add-Ins” menu item to Word 2000, 2003, or 2007 (no ETA for 2010) • Menu items: • insert figure, table, code snippet, generate document
Mediterranean Coast Inventory and Monitoring Network SWord
Mediterranean Coast Inventory and Monitoring Network SWord • SWord embeds R code in Word document as fields tagged by {<<xxx>>= } and {@} • In foo.doc, Sword runs foo.R in same directory, then embedded code • Foo.R can create lattice and table or dataframe objects, define functions to generate tweaked graphs • Embedded code then print(object) or plot(object) • Source foo.R as appendix in report • Complete documentation for how missing values handled, graph options, etc.
Mediterranean Coast Inventory and Monitoring Network CHIS Kelp Forest Monitoring • KFMreport.doc • Cover, TOC, headers, footers, boilerplate text • KFMreport.R code • Hits Access tables, cleans, slices, dices, generates lists of objects • Embedded fields • plot() lattice objects • Tables or dataframes to MSword Tables
Mediterranean Coast Inventory and Monitoring Network CHIS Kelp Forest Monitoring
Mediterranean Coast Inventory and Monitoring Network Subsequent Years • Collect Data • Data entry, QA/QC • Copy/rename files KFM_AnnualReport2013.doc KFM_AnnualReport2013.R • Menu: Run SWord then Generate Document • Look at tables & figures • Write interpretation & discussion • Periodically revise boilerplate • Periodic Synthesis Reports
Mediterranean Coast Inventory and Monitoring Network Next Steps • Almost complete collection of possible figures • David & Stacey ideas, tweaks, rejections, requests once they know what is possible • Tom recode against NRDT re-factoring • Possible generation 2011 annual report
Mediterranean Coast Inventory and Monitoring Network Guidance for Networks • Tom will post more detailed instructions and examples on the NPS I&M R website • http://science.nature.nps.gov/im/monitor/stats/R • As Vital Signs monitoring data start rolling in, you can try to spend a great deal of time constructing annual reports for 1 or 2 new Vital Signs each year • Much less effort to maintain & reproduce in subsequent years
National Park Service Inventory and Monitoring Program • Swap Meet • Authors and co-authors scattered around room • Available for specific questions, requests for copies of reports, code, etc.