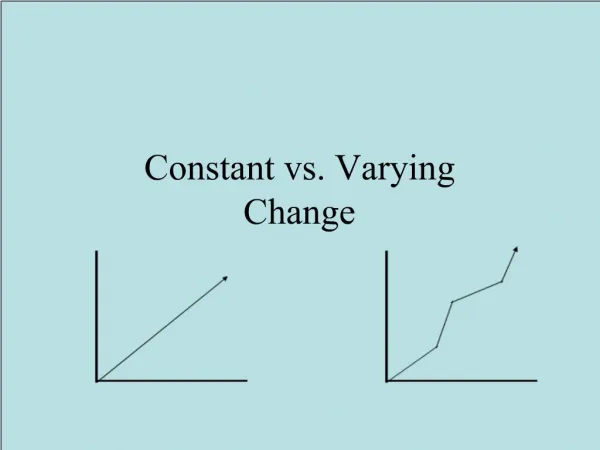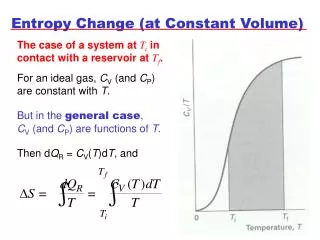
Constant vs. Varying Change
Constant vs. Varying Change. Consider the following…. Consider the following…. A new pencil is placed in an electric sharpener. Study the following chart. Does this chart show an increase or a decrease?. As time goes by, the length of the pencil is decreasing. Minus 2 inches.
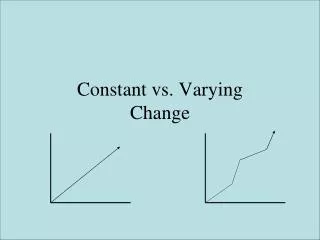

Constant vs. Varying Change
E N D
Presentation Transcript
Consider the following… A new pencil is placed in an electric sharpener.
Study the following chart. Does this chart show an increase or a decrease?
As time goes by, the length of the pencil isdecreasing. Minus 2 inches Minus 2 inches Minus 2 inches
This is aconstantrate of decrease.The pencil shrinks by 2 inches every ½ minute. Minus 2 inches Minus 2 inches Minus 2 inches
A Pencil’s Changing Length In A Sharpener 10 How much time must pass before the pencil is gone? Lengthofpencil 9 8 7 6 5 4 3 2 1 0 0 1 2 3 4 Time (in minutes)
A Pencil’s Changing Length In A Sharpener 10 Lengthofpencil 9 8 7 EXTEND THE GRAPH. 6 5 4 3 2 1 0 0 1 2 3 After 2 ½ minutes, the pencil will be gone. Time (in minutes)
Consider the following… Jack puts $5 into his piggy bank every week.
Study the following chart. Does this chart show an increase or a decrease?
As time goes by, Jack’s savings is increasing. Plus $5 Plus $5 Plus $5
This is aconstantrate of increase.Jack gains $5 each week. Plus $5 Plus $5 Plus $5
Jack’s Savings Numberofdollars 50 If Jack wants to have $45 in his piggy bank, for how many weeks must he save? 45 40 35 30 25 20 15 10 5 0 0 1 2 3 4 5 Time (in weeks)
Jack’s Savings Numberofdollars 50 45 40 35 EXTEND THE GRAPH. 30 25 20 15 10 5 0 After 9 weeks, Jack will have $45. 0 1 2 3 4 5 6 7 8 9 Time (in weeks)
Consider the following… John works the concession stand at football games
Study the following chart. Does this chart show an increase or a decrease?
As time goes by, the number of hotdogs sold isincreasing. Plus 7 Plus 18 Plus 5
This is avaryingrate of increase.Plus 7/Plus 18/Plus 5 Plus 7 Plus 18 Plus 5
Hot Dog Sales Numberofhotdogs 50 Notice how the graph does NOT make a straight line. This is an example of change that is NOT constant. 45 40 35 30 25 20 15 10 5 0 5:00 5:15 5:30 5:45 Time
Consider the following… Jim is checking his heart rate every minute. He is in a relaxed state.
Study the following chart. Does this chart show an increase or a decrease?
There is neither an increase nor a decrease. There is NO change. Plus 0 Plus 0 Plus 0
Jim’s Resting Heart Rate Numberofbeatspermin. 100 This is an example of a graph that shows NO CHANGE. 90 80 70 60 50 40 30 20 10 0 1:00 1:05 1:10 1:15 Time
1) Determine the kind of change represented by the chart. A) Constant Increase D) Varying Increase B) Constant Decrease E) Varying Decrease C) No Change F) None of the above
1) Determine the kind of change represented by the chart. A) Constant Increase D) Varying IncreaseB) Constant Decrease E) Varying Decrease C) No Change F) None of the above Minus 5 Minus 5 Minus 5
2) Determine the kind of change represented by the chart. A) Constant Increase D) Varying Increase B) Constant Decrease E) Varying Decrease C) No Change F) None of the above
2) Determine the kind of change represented by the chart. A) Constant Increase D) Varying Increase B) Constant Decrease E) Varying Decrease C) No Change F) None of the above Plus 8 Plus 16 Plus 32
3) Determine the kind of change represented by the chart. A) Constant Increase D) Varying Increase B) Constant Decrease E) Varying Decrease C) No Change F) None of the above
3) Determine the kind of change represented by the chart.A) Constant Increase D) Varying Increase B) Constant Decrease E) Varying Decrease C) No Change F) None of the above Plus 25 Plus 25 Plus 25
4) Determine the kind of change represented by the chart. A) Constant Increase D) Varying Increase B) Constant Decrease E) Varying Decrease C) No Change F) None of the above
4) Determine the kind of change represented by the chart. A) Constant Increase D) Varying Increase B) Constant Decrease E) Varying Decrease C) No Change F) None of the above Minus 15 Minus 10 Minus 5
5) Determine the kind of change represented by the chart. A) Constant Increase D) Varying Increase B) Constant Decrease E) Varying Decrease C) No Change F) None of the above
5) Determine the kind of change represented by the chart. A) Constant Increase D) Varying Increase B) Constant Decrease E) Varying DecreaseC) No Change F) None of the above
6) Determine the kind of change represented by the graph. A) Constant Increase D) Varying Increase B) Constant Decrease E) Varying DecreaseC) No Change F) None of the above Numberofbeats Jim’s Heart Rate After Running 1 mile 120 115 110 105 100 95 90 85 80 1:00 1:01 1:02 1:03 1:04 1:05 1:06 1:07 1:08 Time
6) Determine the kind of change represented by the graph. A) Constant Increase D) Varying IncreaseB) Constant Decrease E) Varying DecreaseC) No Change F) None of the above Numberofbeats Jim’s Heart Rate After Running 1 mile 120 115 110 105 100 95 90 85 80 1:00 1:01 1:02 1:03 1:04 1:05 1:06 1:07 1:08 Time
7) Determine the kind of change represented by the graph. A) Constant Increase D) Varying Increase B) Constant Decrease E) Varying DecreaseC) No Change F) None of the above NumberofStudents Students in Period 1 Math Class 35 30 25 24 23 22 20 19 18 Aug Sep Oct Nov Dec Jan Feb Mar Apr Month
7) Determine the kind of change represented by the graph. A) Constant Increase D) Varying Increase B) Constant Decrease E) Varying DecreaseC) No Change F) None of the above NumberofStudents Students in Period 1 Math Class 35 30 25 24 23 22 20 19 18 Aug Sep Oct Nov Dec Jan Feb Mar Apr Month
8) Determine the kind of change represented by the graph. A) Constant Increase D) Varying Increase B) Constant Decrease E) Varying DecreaseC) No Change F) None of the above NumberofDeer(in100s) Deer Population 8 7 6 5 4 3 2 1 0 Aug Sep Oct Nov Dec Jan Feb Mar Apr Month
8) Determine the kind of change represented by the graph. A) Constant Increase D) Varying Increase B) Constant Decrease E) Varying DecreaseC) No Change F) None of the above NumberofDeer(in100s) Deer Population 8 7 6 5 4 3 2 1 0 Aug Sep Oct Nov Dec Jan Feb Mar Apr Month