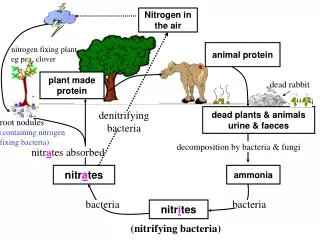
Nitrogen in the Environment
Nitrogen in the Environment. Peter Scharf University of Missouri Agronomy Extension. Nitrogen in the Environment. From where? With what effects? How can adverse effects be addressed?. Nitrogen in the Environment--From where?. Recycling of biological N Newly-introduced biological N


Nitrogen in the Environment
E N D
Presentation Transcript
Nitrogen in the Environment Peter Scharf University of Missouri Agronomy Extension
Nitrogen in the Environment • From where? • With what effects? • How can adverse effects be addressed?
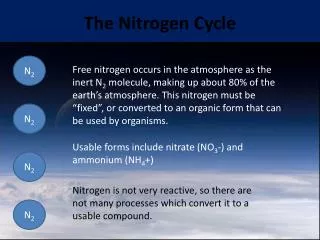
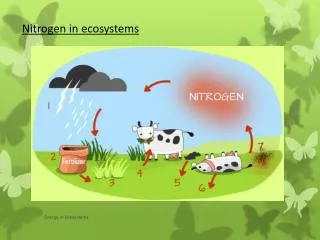
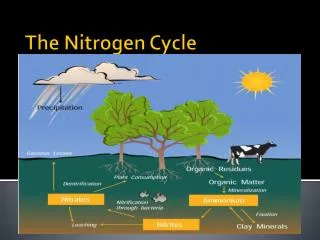
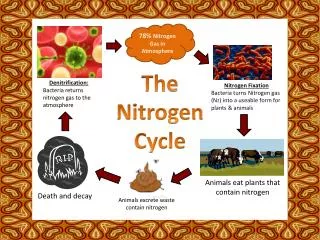
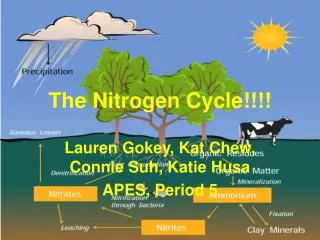
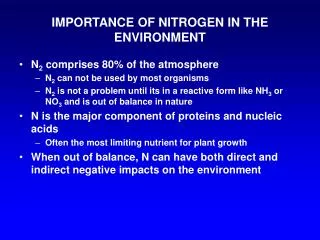
Nitrogen in the Environment--From where? • Recycling of biological N • Newly-introduced biological N • Fertilizer N • Leguminous plants • Fossil-fuel combustion • Lightning All from N2 in air
Ag Ag Ag Ag Urban
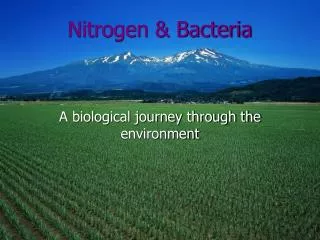
Agriculture as a nitrogen source • The bulk of biologically available N is associated with agriculture • It can be hard to trace the movement of this N to the environment, but most environmental N is probably from ag
Nitrogen: effects on the environment • Water quality is the main concern • Overproduction in coastal waters • Nitrate in drinking water • No major problems within Missouri • DNR is currently setting nutrient standards for water • Species shifts in low-productivity land ecosystems • Deserts • Alpine lands No TMDLs!
Overproduction in coastal waters • Nitrogen is the most growth-limiting nutrient in sea water • Adding N to sea water increases growth of marine plants (same as on land) • What is “overproduction”, why is it a problem? Mississippi R. water (high N) Gulf of Mexico water (high P)
Mouth of Mississippi River Satellite image of phytoplankton bloom
Overproduction in coastal waters • Excessive productivity of aquatic plants causes: • oxygen depletion of water • death or migration of oxygen-sensitive species • increases in the incidence of toxin-producing blooms • loss of submerged aquatic vegetation (habitat) due to increased turbidity
Overproduction in coastal waters • This type of problem has been seen in: • The Gulf of Mexico (“hypoxia”, or, “The Dead Zone”) • The Chesapeake Bay • Long Island Sound • Pamlico Sound • The Black Sea • The Baltic Sea
Gulf of Mexico Hypoxia Area of hypoxic zone, June 1996 Seasonal: usually April to September
EPA Action Plan Target by 2015
N fertilizer in the river • N fertilizer use • started after World War II • increased until 1980 • pretty much level since 1980 • Mississippi River N • increased from 1950-1980 then leveled off • Transport from farms to the river is hard to measure, not well understood
Hypoxia and N fertilizer • Hypoxia is associated with an algal bloom • Long experience and theory suggests that N input increases the size of the bloom
Hypoxia and N fertilizer • Is the size of the Gulf hypoxic zone controlled by N use on land? • We can’t really answer this question • The size of the hypoxic zone has only been measured since 1985 • N fertilizer use & Mississippi River nitrate concentration have been nearly level • Water flow has mainly controlled the size of the zone 1985 to present
Nitrates in drinking water • Human health concern • 10 ppm nitrate-N limit for drinking water • mainly due to threat of blue baby disease • extremely rare • weakly linked to other health problems
Nitrates in drinking water • 10 ppm nitrate-N limit for drinking water is exceeded mainly in wells (NE, KS) • Also exceeded in some rivers used for drinking water • Des Moines River in Iowa • Illinois? • But none in Missouri, except the Des Moines River at the northeast border
Relative nitrate concentrations • 10 ppm nitrate-N is health advisory limit for human consumption • Mississippi River water entering the Gulf of Mexico is about 2 ppm • enough to cause large hypoxic zone • about three times higher than in 1960 • critical nitrate-N concentration in water is higher for drinking water than for hypoxia
How can the adverse effects of N be addressed? • Need to focus on agricultural sources of N • Primarily fertilizer N • Also N from soil organic matter, manure, legumes • Taking advantage of easy progress in municipal & industrial N also makes sense
Agricultural N: reducing environmental effects • Reduce N loss from fields (source reduction) • Intercept and remove N from water between edge of field and coast • Remove nitrate from drinking water
Reducing N loss from ag fields • First: understand transport of N from ag fields to surface water
N transport to water resources • Runoff is a minor pathway in most cases • Nitrate leaching is the major pathway • movement with percolating water • to groundwater (permanent or transient) • substantial groundwater emerges to surface as springs & seeps • artificial drains in agricultural fields directly move leached nitrate to surface waters
Nitrate in base flow New road cut on highway 63 in northern Missouri, summer 2004 Landscape slope Loess cap Old glacial till (dense)
N transport to water resources • Missouri MSEA: 15 times more N leached than in runoff • Iowa MSEA: 16 times more N entering stream via subsurface flow than in runoff • Georgia: 115 times more N in subsurface flow than in runoff (Jackson et al., 1973)
Major point #1:Best Management Practices (BMPs) aimed at reducing runoff will have no effect on N movement to ground and surface waters
N transport to water resources • Grasslands/forages leach very little N • Not much water percolation • Dense growth, long growing season • Little free nitrate, great potential to take up nitrate
Major point #2:Very little N is lost from forages to water resources
N movement to surface waters via artificial drainage • Drainage lines are a direct pipeline from the root zone to the river • Fenelon & Moore (1998): much more nitrate entering river from subsurface drains than from base flow (Indiana)
Artificial drainage Undrained field Surface-drained field Drainage provides a huge grain production and economic benefit Subsurface-drained field
Major point #3:Focusing nitrogen management BMPs in areas with considerable drainage is likely to have maximum impact on N movement to surface waters Not Missouri!!
N transport to water resources • Nitrate leaching occurs mainly during the “recharge period” when precipitation exceeds evapotranspiration • In Missouri, this may last from October to May • Nitrate in the soil from October to May is vulnerable to loss • Mainly unused N left after harvest
Reducing N loss from ag fields • First: understand transport of N from ag fields to surface water • Second: reduce unused N left at harvest How?
Matching N rate to crop need reduces soil N at harvest Soil nitrate in the top 4 feet after harvest is high only when optimum N fertilizer rate for corn is exceeded. Centralia, MO, 2000
Matching N rate to crop need • Applying only as much N as the crop needs at any particular place reduces: • N remaining in soil at harvest • N leached from root zone • N in base flow?
Matching N rate to crop need • It’s actually very difficult to predict how much N fertilizer is needed • It depends on the amount available from the soil, which is hard to predict and highly variable • There is no good method in common use by farmers • N need is highly variable from one field to the next and also within fields
Matching N rate to crop need: an example • pivot-irrigated cornfield near Oran, Missouri in 2000 • Nitrogen rates from 0 to 250 lb/acre were applied all across this field, and resulting yields were measured
Crop need for nitrogen varies widely within fields How do you fertilize this field?
Matching N rate to crop need—how? • Soil nitrate test • Yield goal • Soil texture • Crop color
Matching N rate to crop need: crop color • N-deficient plants are much lighter and yellower than plants that have enough N
Matching N rate to crop need: crop color • Tools • Chlorophyll meter • Aerial photographs • Vehicle-based radiometers
Applicator-mounted sensors • Variable-rate N sidedress based on sensor readings: • 7 producer-field demos in 2004 • Dark green gets low N rate • Lighter green or yellow gets high N rate sensors
Matching N rate to crop need: crop color • Advantage: predictions of N need are much more accurate than those from soil tests or yield goals • I believe that ultimately these practices will be widely adopted to allow full crop productivity while minimizing N lost to water resources • Disadvantage: waiting until crop shows N need to apply fertilizer creates risk and inconvenience • Economic incentive from production side alone is not adequate for adoption
Major point #4:Matching N rate to crop need, at times appropriate to efficient crop uptake, has great potential to reduce agricultural N loss to water resources
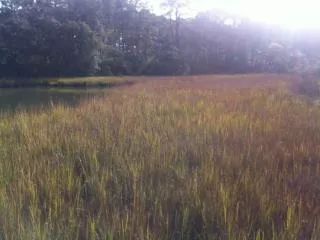
Interception/mitigation • Once the nitrate-N has leached from the root zone, what kinds of BMPs can reduce movement to water resources? • To groundwater: effectively no BMPs available • To surface water: • riparian zones • natural or artificial wetlands
Riparian zone/wetland functions • NOT related to runoff (for N) • Root interception and uptake of groundwater nitrate • deep-rooted trees • wetland species where groundwater is shallow/emergent • Denitrification • especially in wetlands, favored by high-carbon, low-oxygen conditions
Source reduction vs. interception/mitigation • Presidential Commission on Gulf of Mexico Hypoxia report: • reducing N inputs to the Gulf of Mexico will be much cheaper via source reduction BMPs than via interception/mitigation BMPs
SUMMARY • Nitrate in drinking water (human health) and N in coastal waters (hypoxia) are the major N/water quality issues • Most N in water probably originates from agricultural sources • Reducing N in runoff will not effectively address either issue
SUMMARY (cont’d) • BMPs will be most effective in reducing N movement to surface waters when used in areas with lots of drainage (Iowa & Illinois) • Source reduction BMPs (matching rate to crop need, proper timing) will probably be more cost-effective than interception/mitigation BMPs