Download
1 / 27
270 likes | 358 Views
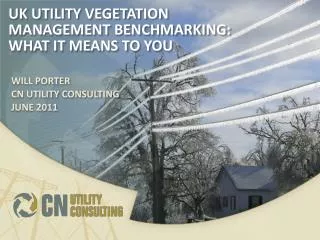
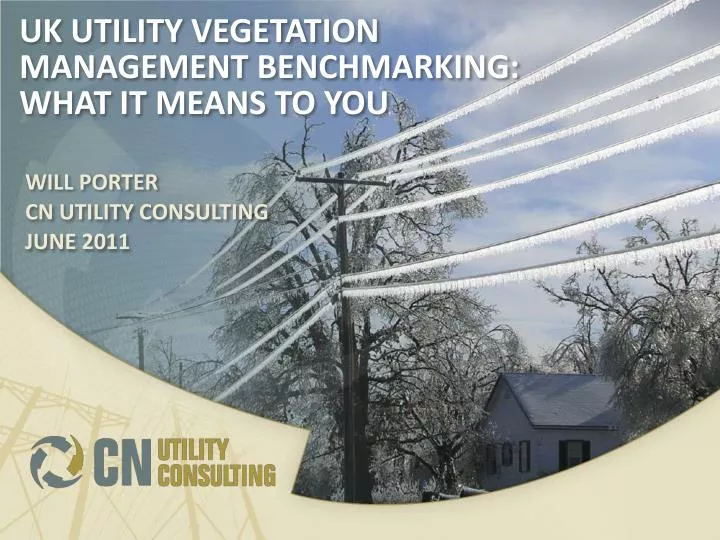
UK Utility Vegetation Management Benchmarking: What it means to you. Will Porter CN Utility Consulting June 2011. Benchmarking: What it means to you overview. WHY BENCHMARK? A BRIEF HISTORY OF BENCHMARKING HOW REGULATORS CAN BENEFIT HOW DNOs CAN BENEFIT HOW VENDORS CAN BENEFIT

E N D
UK Utility Vegetation Management Benchmarking:What it means to you Will Porter CN Utility Consulting June 2011
Benchmarking: What it means to youoverview • WHY BENCHMARK? A BRIEF HISTORY OF BENCHMARKING • HOW REGULATORS CAN BENEFIT • HOW DNOs CAN BENEFIT • HOW VENDORS CAN BENEFIT • HOW FIELD PERSONNEL CAN BENEFIT • HOW THE PUBLIC CAN BENEFIT • CNUC ‘S ROLE
Why benchmark? A brief history OF BENCHMARKING • “Those who always go it alone are doomed to perennially reinvent the wheel, for they do not learn and benefit from others’ progress.” Bogan, CEO of Benchmarking Co., and English, Quality Manager of GTE • In 1970’s the word “Benchmark” (surveying term for reference point) moved into the business lexicon meaning the measurement process for making comparisons. • “[Benchmarking is] a process for rigorously measuring your performance versus the best-in-class companies and for using the analysis to meet and surpass the best-in class.”Kaiser Associates • “Benchmarking is the search for industry best practices that lead to superior performance.”Robert Camp, Xerox Corp.
WHY BENCHMARKING? ALLOW INNOVATION TO REALIZE ITS FULL POTENTIAL
WHY BENCHMARKING? OBJECTIVES AND BENEFITS • Benchmarking is an on-going process to promote continuous improvement and adaptive innovation. • Benefits Gleaned from Practitioners of Benchmarking: • Paradigmatic Shifts or Buy-ins to Change • Teaches New Lessons in Competitiveness • Catalyst for Learning • Raises Level of Maximum Potential Performance • Creates a Culture Open to Change • Exposes People to New ideas • Improves Organizational Quality • Leads to Lower Costs • Bogan and English • Major Focus of Benchmarking for all entities will be to • Identify Best Practices and Continuous Improvement
How regulators can benefit • Equips Subject Experts with Industry Knowledge for Crafting Regulations • Measure Effectiveness of Regulations and Standards • Understand Individual DNOs Budget Issues and Reasons for Variations in the Industry • Develop Public Awareness as to Why Utility Vegetation Management is Important to Safety, Reliability and Compliance to Regulations--Makes Regulations Defensible
HOW DNOs can benefit • Measures UVM Program Success in Achieving Objectives • Provides Support for Budget Allocations Necessary for DNOs to Meet Objectives • Analyzes the Rationale for Rate Increases • Explains Variations in Production Between DNOs and Between Internal Regions or Districts • Continuous Improvement by Identifying Best Practices and Communicating New Developments in the Industry • Designing and Establishing Defensible UVM Programs
UTILITY OBJECTIVES FOR PERFORMING UVM RANKED IN ORDER OF IMPORTANCE
ANALYSIS OF VARIATION AT COMPANY Q The Northern Territory Has the Lowest Customer Density The Northern Territory Has the Highest Cost per Managed Kilometre Labour Hours per Managed Kilometre Follow Same Trends as Cost The Southern Territory Has the Lowest Cost per Kilometre
ANALYSIS OF VARIATION AT COMPANY Q The Northern Territory Has the Highest Tree Density The Northern Territory Has the Lowest Labour Hours per Tree The Southern Territory Has the Highest Labour hours per Tree The Southern Territory Has the Lowest Tree Density
DEFENSIBLE UVM PROGRAMS Defense of UVM Programs Using Evidence Derived from Benchmarking “The PUD’s expert, Mr. Stephen Cieslewicz, …a national consultant on vegetation management practices for utility companies. …stated that the vast majority of companies, with the exception of some in California near fire areas, do not routinely inspect trees outside the clearance zone simply because the tree is tall enough to fall on the line.” [He further stated that], “ . . . the objective of line clearance inspections is to review the air space between the lines and along the lines for trees or limbs, and that unless the company knew of a problem tree, by direct observation or otherwise, it would have no duty to undertake tree inspection.” Connelly vs. PUD Summary Decisions • In 2006, only 31% of Surveyed Utilities Had a Hazard Tree Program • In 2009, 56% of the Utilities Had a Hazard Tree Program • In 2006, 29% Developed Specific Processes and Procedures for Hazard Tree Evaluations • In 2006, 56% of Companies Had Pre-Inspection and Planning in their Contracts, But Only 27% Hired Vendors Specifically for Pre-Inspection
How Vendors can Benefit • Getting Safety Data Analyzed by Impartial Third Party to Maintain Confidentiality • Safety Measurements Can Be Correlated with UVM Program Attributes • Discovering Variables that Lead to Improvements in Safety • Measuring and Understanding the Correlations Between Methodology and Contract Structures
SAFETY STATISTICS • Comments by Participants About Safety Statistics: • Contractor unwilling to share safety stats • Vehicle accident rate & outages per crew hour • Contractor lost time incidents [only] • [Statistics] Not Available
TREE PRUNING AND TREE REMOVAL CONTRACT STRUCTURES Used for Contract Reviews and Could be Correlated to Discover Best Practices
How Field Personnel might Benefit • Provide Best Practices for Performing UVM • Benchmark Discoveries that Could Lead to Improvement in Safety • Review New Technology and Equipment for Performance in the Field
FIELD PERSONNEL ESSENTIAL TO PROCESS • Ultimately the People in the Field Should Be the Benefactors of a • More Efficient and Safer System that Strives Towards • Constant Improvement • Field Personnel Are Essential in Collecting Data that ultimately • becomes a part of Benchmarking • Field Personnel Know More About Specific Conditions Present than • Any Other Entity • Field Personnel Have More Direct Contact with the Public than • Any Other Entity • Sharing Strategic Benchmark Knowledge Between Field Personnel, • the DNOs, Regulators, and the Public Is a Strategy to Lead • the Industry in a Direction that Benefits All
How the Public can benefit • Statistics that Demonstrate the Importance of UVM to Public Safety and Electrical Reliability • Educate the Public with These Statistics To Aid in Acceptance of UVM • Acceptance Could Lead to a Safer and More Reliable Electrical System
BEST PRACTICES FOR EDUCATING THE PUBLIC Effective Practice That Is Underused in the Vegetation Management Industry • The Use of Focus Groups Has Decreased From 35% to 25% From 2002 to 2006 • 75% of Companies That Used Focus Groups Resulted in Changes to UVM Programs • Changes Included (Comments by Benchmark Participants): • We were able to remove previously trimmed trees in towns and replace with low growing species as well. • We changed our distribution notification process • Customer survey [of] recent tree trimming projects to get feedback on contractor performance. Contractors are more PR engaged. • In the early years of directional pruning a focus group decision process helped ease our established neighborhood’s [adjustment] to the new pruning method. • Only One Company out of 48 Used Customer Focus Groups Routinely As One Benchmark Participant Said, “. . . our activities directly impact customers more than any other activity at our utility.”
Cnuc’s Role • CNUC’s Background and Use of Benchmarking in the UVM Industry • Historical Data with Large Sample Size • Confidentiality Options • Survey Design • Survey Quality Management • Survey Analysis • On-Going Program –Continuous Improvement
CONFIDENTIALITY FOR DNOs • CN Utility Consulting has practiced the following Confidentiality Rules in the past and current North American Benchmarks: • All participating companies have their name published with the Benchmark reports and publications. • The information supplied by the participants is confidential and is represented in the publications by a coded number. • Code number for each company is only supplied to that utility. • Companies can reveal themselves to another company and CNUC will act as the intermediary. • Confidentiality Options for United Kingdom DNOs: • Open Benchmarking • Can divide DNOs into regions, like Company Q in earlier example, to increase sample set. The regions would be randomly mixed to make DNOs identities more confidential. • Mix DNOs with North American companies that compare well geographically, economically and have similar vegetation densities and customer densities. Unfortunately, the regulatory drivers will be different.
CONFIDENTIALITY FOR VENDORS • Confidentiality for Vendors : • Safety #1 Objective for UVM in North America • Need reliable statistics for correlations • Need standard definitions for safety metrics • Need access to data from each entity who performs UVM –DNO, contractor and subcontractor • Accident data, safety education and safety Initiatives • Compare elements of different safety cultures • Confidential Collection of Data Options: • Confidential Data Collection (Preferable) • Double Blind Collection • Only Statistical Metrics Will Be Shown, No Raw Data • Separate Survey for Contractors on Safety
SURVEY DESIGN, QUALITY MANAGEMENT AND ANALYSIS • Survey Design is Continually Changing to Meet the Needs of the Participants • Benchmarking Participants Can Create, Revise, Edit or Comment on Survey Questions in Development • Question Development Is a Function of Previous Survey Responses , Previous Analysis and Changes in the Industry • Responses are Verified if Data Is Questionable – Survey Follow-ups • Years of Experience Have Improved Survey Design and Ability to Recognize the Accuracy of Data • Continually Discovering New Ways to Correlate Data for Analysis • New Correlations Help in the Search for Best Practices and Adaptive Improvements • Shorter In-Depth Surveys Keep Benchmarking an On-Going Process