Download

1 / 24
240 likes | 392 Views
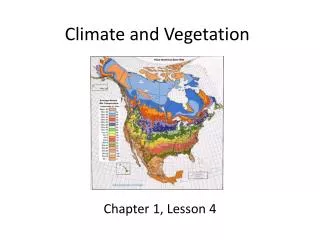
Vegetation feedback and Droughts. Russell Bird – 3 rd Year Atmospheric Science .

E N D
Vegetation feedbackand Droughts Russell Bird – 3rd Year Atmospheric Science
Papers Examined:the perfect ocean for drought – Martin Hoerling and Arun KumarOn the cause of the 1930’s dust bowl – Siegfried d. Schubert, max J. Suarez, Philip J. Pegion, Randal D. Koster, and Julio T. Bacmeister
“Did the 1998 – 2002 droughts share a common influence?” • “Were slow, external forcings responsible for maintaining drought conditions across the mid latitudes?” • “Are greenhouse gas emissions responsible for intensifying the global hydrological cycle in the 20th century?”
Annual Average SST4 –year period:1998-2002 Temperature anomalies in Celsius Precipitation anomalies in mm/year
What Does this mean? A: 1998-2002 drought may have resulted from ENSO: 1) Evidence of a “cold phase” of la nina a) drying over southern USA as well as Mediterranean and western Europe. 2) Cold SST in Indian and West Pacific may have resulted in the Asian drought.
Why the oceans? The oceans can provide persistent circulation over a several year period, and the atmosphere is less capable beyond one month. Ok, but what is the cause of this persistency?
SST anomalies June 1998 – may 2002 Anomalies in degrees Celsius: Left: climatological warm pool region (Indian west Pacific) Right: climatological cold tongue (east Pacific)
Atmosphere was a factor “Persistent tropospheric circulation” was initial cause of the drought. *See the high pressure on next slide*
Observed vs gcm200 mb height anomalies (same 4 year period)departures in meters (gcm forced with observed)
On the cause of the 1930’s dust bowlexamining the SST anomalies
Occurred during the 1930s. • A devastating drought directly affecting the United States, Mexico, and Canada. • Involved significantly lower rainfall for over a decade. • Also involved above average temperatures. • These factors devastated the great plains. The dust bowl
Can we show that ocean temperatures were most significant cause of the drought? • Can we show that the atmosphere and ocean interaction increased the severity of the drought? • How does this data compare with other droughts during the 20th century?
Precipiation anomalies Black – 14 ensemble members from C20C runs (1902-2001). Green – ensemble mean Red – observations Deficits as much as 0.1mm/day peaking at 0.3mm/day
The models didn’t capture the full extent of the drought due to ensemble averaging “which filters out the noise of the graph.” • Variability between the observed and mean is 0.57 • Variability between the mean and observed is between 0.53 and 0.79 • Despite this variability, the models do show a likelihood for dryer conditions during the 1930s (which matches the observations). • The models also predicted the wetter 1940s conditions that followed. Some issues …whoopsie
12 of the models actually predicted a drought that was even worse than the 1930s dust bowl drought. • The models (as well as historical records) indicate that we are likely to have droughts in the great plains once every 20 years. • We were also expected to have a significantly worse drought during the 1970s. Some interesting things
Sst anomalies C20C runs The boxes identify sub regions (tropical, Indian, and Pacific oceans). Anomalies measured in degrees Celsius. “14 100-year runs (1902 -2001) forced by observed monthly SSTs”
What does this mean? According to fixed beta results, the land-atmosphere interaction is the main cause of drought severity. Also, removing soil moisture reduces the variability in feedback. Ergo, the great plains is super sensitive to changes in soil moisture
Is this significant?“Hint: yes.” Proxy records show that droughts in the great plains occur about 1-2 times every century… over the past 400 years. Tree rings suggest that even more severe droughts occurred in the past. Despite past drought, precipitation anomalies have increased during the 20th century.
SST anomalies have a strong correlation with droughts • The atmosphere does play a significant role in drought severity • The dust bowl was influenced mostly by SST • Droughts occur across the great plains once or twice a century • Proxy records show that droughts have occurred in the greats plains for the past 400 years • Although the C20C models aren’t perfect, they do a pretty good job of predicting when the droughts will occur • Precipitation anomalies have increased in the great plains during the 20th century, and could be a result of global warming (not examined in detail in these papers) summary