Download
1 / 16
160 likes | 376 Views
Modeling Images and Spectra of a Solar Flare Observed by the Ramaty High Energy Solar Spectroscopic Imager (RHESSI). Linhui Sui (CUA & NASA/GSFC) Gordon Holman (NASA/GSFC) S ä m Krucker (SSL, UC Berkeley) Brian Dennis (NASA/GSFC). Summary.

E N D
Modeling Images and Spectra of a Solar Flare Observed by the Ramaty High Energy Solar Spectroscopic Imager (RHESSI) Linhui Sui (CUA & NASA/GSFC) Gordon Holman (NASA/GSFC) Säm Krucker (SSL, UC Berkeley) Brian Dennis (NASA/GSFC)
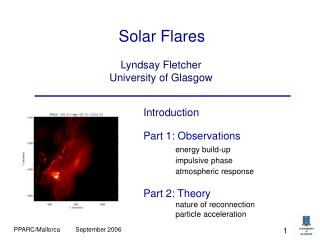
Summary • We have analyzed a C7.5 flare observed by RHESSI on Feb 20, 2002. • Our goal was to determine if the data are consistent with a simple model in which high-energy electrons are injected at the top of a semicircular flare loop. • We compare computed images and spectra from the model with RHESSI images and spectra. • We find the RHESSI results are mostly consistent with the model if a thermal source is included between the loop footpoints. Some problems remain, however. • The RHESSI and model results are presented here along with conclusions derived from the comparison.
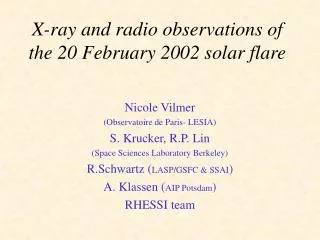
Event of Feb 20, 2002 GOES8, RHESSI, WIND/WAVES GOES8 • C7.5 flare • GOES Start time: 11:02 UT • GOES End time: 11:12 UT • Hard X-ray peak time: 11:06:20 UT • Active Region: AR9825 • Limb flare: N16W80 (919",285") RHESSI WIND/WAVES
Spatially integrated flare spectrum Emission measure: 0.5×1049 cm-3 Temperature: 14 MK Spectral index: -3.3 below 56 keV,-4.5 above 56 keV Photon flux at 50 keV: 0.6 photons s-1 cm-2 keV-1 GOES 8 results Time: 11:06:20 UT Emission measure: 0.3×1049 cm-3 Temperature: 14 MK RHESSI Spectrum RHESSI Light Curve
Flare Images Obtained with Maxima Entropy Reconstruction (MEM Sato) Time Interval: 11:06:10 – 11:06:23 UTSpatialResolution: 7"
Flare Images Obtained with CLEAN Time Interval: 11:06:10 – 11:06:23UT SpatialResolution: 7″
Preliminary Imaging Spectroscopy Spectra from MEM SATO images Spectra from CLEAN images Foot Point Spectral Slope: -3.1Loop top Spectral Slope: -4.3
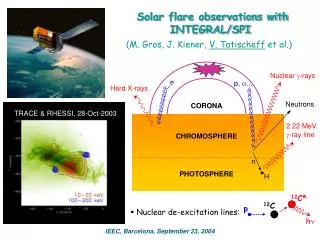
Flare Loop Model • Semicircular loop • Electrons with power-law energy distribution & isotropic pitch angular distribution, injected at loop top • Steady-state electron spatial and spectral distributions within the loop obtained with Fokker-Planck code (McTiernan & Petrosian 1990). The code includes Coulomb scattering & energy losses and magnetic mirroring • Hard X-ray emission from coronal loop and foot points computed using thin-target and thick-target bremsstrahlung codes • Hot plasma assumed to fill the loop uniformly
Flare Model Parameters • Radius of the loop: 17"; Diameter of the magnetic tube: 4" • Density of nonthermal electron injected at loop top: 2×107 cm-3 • Nonthermal electron power-law spectral index: -4.6 below 56 keV,-5.6 above 56 keV • Plasma density and temperature within the loop: 4.0×1010 cm-3and 7 MK • Based on the RHESSI images, we add an extra thermal source (Length: 20"; Width: 4";Depth: 4") between the two footpoints, shifted 5" from the center of footpoints towards the north footpoint. Plasma density: 1.0×1010 cm-3; Temperature:14 MK • Magnetic field: 200 Gauss at loop top, 600 Gauss at the footpoints • Plane of loop rotated 53º from plane of sky
Model Loop Images and Spectra Loop Top Spectral Index: -5.3 -6.3 Foot Points -3.4 -4.4
Simulation Images from the Model with Maxima Entropy Reconstruction (MEM Sato)
Simulation Results Discussion 1. Artificially Enhanced Flux Both MEM Sato and CLEAN imaging algorithms make the loop top about 20% brighter than the actual flux. Superposition of side lobes artificially increases the loop top flux. Image reconstruction cannot totally subtract them from the images. Model ImageCLEAN Image MEM Sato image from Model from Model 16 keV
2. Artificial Sources • We can also see some artificial sources. These are from the side lobes of real sources. Many of these artificial sources are also visible in the RHESSI images. MEM SATO Image from Model RHESSI Image
A Problem with the Single Loop Model? Although the radiation from the two footpoints starts and ends at almost the same time, the peak time of the north footpoint is about 8 second before that of the south footpoint. This may indicate that the flare geometry is more complicated than the single loop model. Time history of the emission from each footpoint • Image of the two footpoints • (20 – 25 keV)
Conclusions The steady-state, single loop flare model provides a good description of the loop top and footpoint sources in the RHESSI images. The data require the presence of an additional, low-lying thermal source between the footpoints. Application of the model has allowed us to identify spurious sources in the RHESSI images. We have also been able to derive fundamental physical parameters for the flare. There are two areas of concern: the delayed brightening of the southern footpoint relative to the northern footpoint and the spectral index of the loop top source, which is smaller than predicted.