Download
1 / 26
260 likes | 461 Views
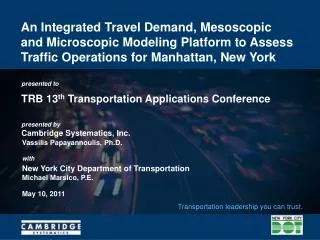
An Integrated Travel Demand, Mesoscopic and Microscopic Modeling Platform to Assess Traffic Operations for Manhattan, New York. TRB 13 th Transportation Applications Conference. May 10, 2011. Vassilis Papayannoulis, Ph.D. with New York City Department of Transportation Michael Marsico, P.E.

E N D
An Integrated Travel Demand, Mesoscopicand Microscopic Modeling Platform to Assess Traffic Operations for Manhattan, New York TRB 13th Transportation Applications Conference May 10, 2011 Vassilis Papayannoulis, Ph.D. with New York City Department of Transportation Michael Marsico, P.E.
Manhattan Network Complexity • Congestion • Grid structure • Parking • Pedestrians and bikes • Buses • Taxis
Manhattan Network Complexity (continued) • Truck deliveries • Traffic enforcement agents • Managed-use lanes • Traffic signal coordination • Bridge and tunnel operations
Available Models • The Regional Activity-Based Travel Demand Model (NYMTC’s Best Practice Model (BPM)) • Other agency activity or four-step travel demand models • Individual project-based microsimulation models that cover a subarea or an individual corridor
The Genesis of the Model • Traffic stipulations historically were based on knowledge of the network and the anticipated impacts • There are programmed and existing major construction projects throughout the network • It became apparent to NYCDOT that there was a need for an analytical tool that would permit the assessment of network-wide cumulative impacts • The first application is the proposed 34th Street Transitway
34th Street Transitway Modeling Goals and Objectives • Develop a modeling platform to assess operational conditions in the Manhattan CBD, emerging from the proposed 34th Street Transitway design • Develop a modeling platform to assist in the refinement of proposed design for the 34th Street Transitway • Develop a modeling platform that could be used in the assessment of cumulative impacts on other current/future regional and local projects • Develop a base network that could be a cornerstone for future analyses and or expansion to other boroughs
Multiresolutional Model Benefits • “Step-down” from the regional model (BPM) • Link travel demand forecasting and traffic operations • Align program and project development processes • Better support robust and inform decisions • Provide the basis for a decision-support system MACRO MESO MICRO
Benefits of Utilizing a Mesoscopic Model • Data from mesoscopic model can be fed directly into microsimulation/traffic operations analysis • Used where the operational capabilities are needed but a microsimulation model may not be feasible due to • Network size • Limited resources available • More precise and cost-effective method of alternatives screening without microsimulation of every alternative
Aimsun Integrated Transport Modeling Macro, Meso, and Micro Simulation Management Forecasting Planning Control Visualization
Large Scale Model Challenges • Data availability • Data collection • OD matrices • Model structure • Coding procedures • Temporal distribution
Large Scale Model Challenges (continued) • Validation • Calibration • Mode shift • Tunnel and bridge operations • Impact of various scheduled projects
Analytical Issues • Origin-destination (OD) matrix estimation • Network geometry and coverage detail • Duration of simulation • Vehicle types to be modeled • Level of validation (strategic versus local) • Temporal distribution data source • Software adaptation
Meso Trip Table Development • Validation of NYMTC’s BPM model at the boundaries of the mesoscopic study area • Extracted trip table for meso model will need adjustment • Origin-destination matrix estimation techniques (ODME) • OD surveys to enhance “seed” table available • Vehicle types (autos, taxis, and trucks) • Taxi GPS data • Initial temporal distribution based on the BPM
Manhattan Traffic ModelOD Trip Table Development • BPM (TransCAD) • Peak-Period Trip Tables • Subarea Extraction Trip Table Disaggregation PLUTO Data Taxi GPS Survey Origin Destination Matrix Estimation Bridge and Tunnel Survey Data Count Data Time of Day (Diurnal Distribution) Simulation Model (Aimsun)
Network Development • Review of network and zone characteristics of the BPM model, the Broadway model, the Lower Manhattan model, and the Canal model, and the potential for conversion to Aimsun • Network coverage, zone structure, and loading methodology • Consistency of meso- and micro-networks • Review of available topological databases
Network Development (continued) • Data availability or new data collection efforts to support the operating characteristics of the meso- and micro-models (e.g., signal timings, saturation flow rates, etc.) • Field data collection, including parking regulations
Primary Study Area Data Collection • Parking regulations • Number of lanes • Intersection geometry • Signal timings • ATRs • Turning movement counts • Travel-time observations • Curbside activity
Calibration/ValidationKey Issues Strategic versus Local Selection of the calibration parameter values that best reproduce current route choice patterns Selection of the appropriate calibration parameter values to best match locally measured data Validation of the microscopic model utilizing ODs and routes from the mesoscopic model Validation of the models against traffic counts and system performance measures, such as travel time and queues
Calibration/ValidationNetwork, Data, and Routing Activities • Migration of the regional travel demand highway and transit networks to the model proved to be more challenging than originally anticipated • Field data and model traffic operations consistency • Trip table adjustments • Differentiating reaction times by study area • Reconciliation of field observed turning movements and driver behavior
Calibration/Validation Network, Data, and Routing Activities (continued) • Incorporation of toll and distance variables in the Initial and Dynamic Cost function • Development of Initial and Dynamic Cost functions by vehicle type • Testing of route choices utilizing one or more previous travel-time intervals • Testing a variety of values for the toll, distance, and capacity attractiveness coefficients in the cost functions • Local look-ahead distance adjustments
Calibration/ValidationModel Application • Testing the Dynamic User Equilibrium (DUE) with a variety of number of iterations (10-100) • Testing One-Pass Dynamic Traffic Assignment (DTA) • Testing combinations of DTA and DUE • Testing one and multiclass assignments
Calibration/ValidationSoftware Adaptation • Custom script development to deal with dynamic parking regulations • Custom scripts to deal with dynamic lane connection (turning movements) • Modified-lane distribution to better accommodate short and wide sections • Custom view scripts • Custom feedback of paths as an initial starting point for the DUE
Manhattan Traffic Model Team • NYCDOT • STV • Cambridge Systematics, Inc. • Transport Simulation Systems
An Integrated Travel Demand, Mesoscopicand Microscopic Modeling Platform to Assess Traffic Operations for Manhattan, New York Thank You Questions?