Download

1 / 23
230 likes | 359 Views
Scenarios to Management Classes Role of Macro – Economic Analysis Presented by: William Mullins Mosaka Economic Consultants cc 26 November 2013. Mvoti to Umzimkulu WMA NWRCS steps. Socio-Economics: Where does it fit in?. Socio – Economic Approach.

E N D
Scenarios to Management Classes Role of Macro – Economic Analysis Presented by: William Mullins Mosaka Economic Consultants cc 26 November 2013
Mvoti to Umzimkulu WMA NWRCS steps Socio-Economics: Where does it fit in?
Socio – Economic Approach • It is important to keep in mind that the classification process is an integrated process. • The contribution of the socio – economic sector is divided into two groups • The Environmental Goods and Services Activities (EGSA) which deals with the value of the water left in the river. • The Macro – Economic Activities which deals with the value of the water removed from the river.
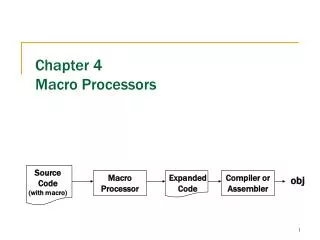
Water Decision Making as a Integrated Process Water Scenario Social Socio - economics Environment Evaluation Process
A little bit of theory • Orthodox theory state that the scarcer a product became, the more valuable the product. • Although this is correct : The water used for economic production will become more valuable. • But how would this fit into a decision making process in river classification? • How do you incorporate this into a model?
Economic Approach • This convinced us to use an approach that the convey the value of the water in “popular” indicators. • It would also be easy to measure the change and contribute to the decision making process.
Also approach • To contribute to the decision making process in evaluating different scenarios during the classification process. • Approach • Establish a baseline • Measure deviation from the baseline. • Part of a integrated decision
Economic Approach • The following approach was used for the different sectors, keeping in mind that this one of three parameters in the final classification: • Irrigation – Farm crop budget approach with elements of Crop – Water production function analysis and Linear Programming (L.P.) Analysis -It is possible to link volume and assurance changes – use a wide range of crops - value expressed in easy understandable parameters. • Mining, Industry. – Based on Statistics SA input- output relationships between product value and macro – economic impact parameters– It is then possible to link the water used to the parameters.
Economic Approach (cont.) C. Tourism was added representing beaches, nature, etc. – Using this as an indicator for the beaches, estuaries ,nature reserves, etc. Linkage between primary sector and secondary sector. The obvious sectors in this project area is sugar cane production and the sugar mills. Also forestry and the saw mills and the pulp factories.
Sectoral structure of the economy • If the primary sector is economically affected, it will spill over to the tertiary sector as well (positive or negative).
Establishing the economic baseline • Macro-economic indicators to determine the impact of the available water. • Gross Domestic Product • Employment • Household Income
Economic Indicators • Why the specific indicator? • Show Economic Growth • Poverty Alleviation Contributors • Gross Domestic Product (GDP) The impact on GDP reflects the magnitude of the values added to the regional and wider economy from activities using the water. Value added is made up of three elements, namely: • Remuneration of employees (payments to households), • Gross operating surplus (which includes profit and depreciation), and • Net indirect taxes.
Economic Indicators • Employment Labour is a key element of the production process. The study estimate the number of employment opportunities currently supported by the use of the water. These employment opportunities is broken down into those created directly by the irrigation sector and those created indirectly and those induced throughout the broader economy • Payments to households One of the elements of the value added (i.e. GDP) which results from the sector where water is allocated is the remuneration of employees, which, in turn, affects households income. Econometric models measures the magnitude of changes that occur to both household income and the spending/savings pattern. As such, the results highlight the impact of water use on the low-income households as this can be used as an indicator of the extent to which the water availability contributes to poverty alleviation throughout the economy.
Modeling of Primary Sector in WIM-model Future inputs • Main Drivers: (Water Volume; Hectares) • Specific Crop Production Budgets (Income and Costs) Inputs: Example - Irrigation Agriculture Income distributed to economic sectors taken up in the economy(Agriculture, Mining, Manufacturing, Electricity, Water, Construction, Trade and Accommodation, Transport and Communication, Financial and Business Services) Economic Water Modelling Multipliers used from derived from Social Accounting Matrix • Direct, Indirect and Induced impacts: • GDP • Employment • Household Income Future outputs Output: Results
Application of Evaluation Criteria - MCDA • It is important to remember that in a river setup the different parameters differ in importance. • In a very rural area employment and the accompanying household income is sometimes more important than the creation of GDP. • In a another setup where for instance industry depends on the product delivered by irrigation (sugar mill) GDP becomes the more important parameter (indicator)
Application of Evaluation Criteria (cont.) • The following grouping is used: • GDP and Second Tier Industry impact • Employment and Household Income (low) • If the irrigation product is negatively impacted • GDP impact calculated • Jobs impact calculated • Relative weights are allocated to the two groups – differ from river region to region • Rating x Weight = Score • Score is transferred to MCDA
TYPICAL WATER RESOURCE SYSTEM – STATUS QUO Small Dams Trout farming, recreation, dry-land agric SFRs Forestry Releases down river for irrigation, urban and industrial Irrigation from canal, high value crops Rural Irrigation Rural: Subsistence, settlements Gorge, protected area Rural Nature Reserve Irrigation. Primary crop for a secondary industry. Town at estuary, industrial (canal & pipeline) Irrigation Industrial Urban Estuary
ECONOMIC CONSEQUENCES SFRs Small Dams All Sc’s cause an improvement on PES. All Sc maintain PES except for Sc C with a positive impact. Rural Irrigation Rural Sc’s B and C provides positive impact while D is negative. Nature Reserve Irrigation Sc’s B and C provides positive impact while D is negative. Industrial Urban Estuary
Some Remarks About Determining Feasibility of New Capital Projects • Decision making indicators of new infrastructure construction: ex- dam, pipelines and canal costs. Cost Benefit Analysis: • Net Present Value (NPV) > 0 • Internal Rate of Return (IRR) > Discount Rate • Benefit - Cost ratio (BCR) > 1 • Comparative tool: Unit Reference Value (URV) • URV = Discounted cost • Discounted water supply
Financial Issues impacting on the final decision but not the classification! • Affordability! • How is the “project” financed? • Who is the implementation agent?