Download
1 / 58
581 likes | 740 Views
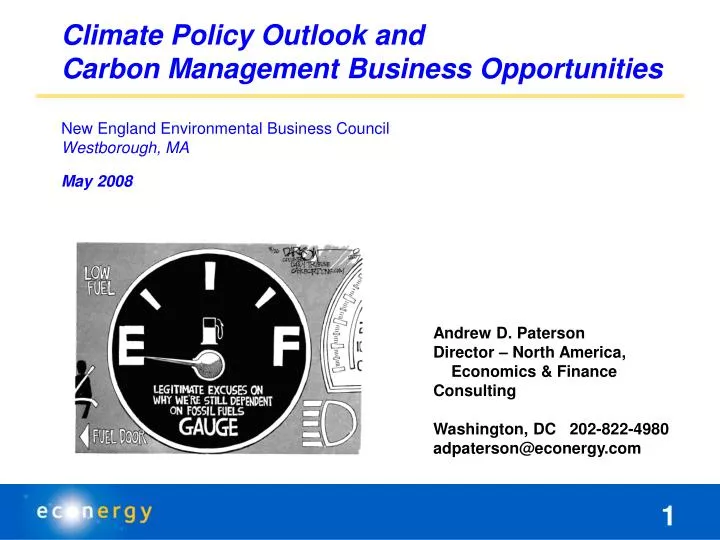
Climate Policy Outlook and Carbon Management Business Opportunities New England Environmental Business Council Westborough, MA May 2008. Andrew D. Paterson Director – North America, Economics & Finance Consulting Washington, DC 202-822-4980 adpaterson@econergy.com.

E N D
Climate Policy Outlook and Carbon Management Business OpportunitiesNew England Environmental Business CouncilWestborough, MAMay 2008 Andrew D. Paterson Director – North America, Economics & Finance Consulting Washington, DC 202-822-4980 adpaterson@econergy.com
ECONERGY’S BUSINESS (“ECG” on London AIM) OFFICES & PROJECTS Raised $100M on London AIM in Feb. 2006 $25M in revenues for 2007, from $3M in 2005.
Climate Policy: Good News / Bad News Good News: • No matter the results of the election in 2008, the federal political landscape will improve dramatically for legislation on GHGs. • Democrats will likely gain +15 in the House, +5 in Senate in 2008. • All three presidential candidates will sign climate legislation • Voluntary efforts, early action, and state initiatives are underway already. Bad News: • A primary excuse for failing to pass GHG legislation vanishes in 2009. • Regional differences within US are physically vast, making consensus on environmental policies very elusive, and with clear leaders and laggards. • China and India + ROW will continue to pump GHGs into the global airshed faster than we curb emissions… without massive infrastructure overhaul. • The federal deficit poses a huge barrier to funding new incentives. • Policy models are not focused well on scale of the fossil economy challenge.
Overview: Environmental Business Opportunities • Environmental Market Update • Progress and plateaus; Growth Markets vs. Large Markets • Politics 2008: Impact on Policy Outlook • Democrats will gain in Congress… plus the White House (?) • But, the country will remain divided: Red vs. Blue • Carbon Policy Options & Financing Issues • Supreme Court: Impact of Mass v. U.S. EPA (April 2007) • U.S. and Global Carbon Emission Outlook • The scale of the fossil economy is daunting worldwide • Socolow’s Wedges as a basis for Business Strategy • The WBCSD Framework (long-term) vs. Kyoto (short term) • The Bond Market: The critical market for financing clean energy
U.S. Environmental Market Growth Rides on Resources Environmental legislation in 1970s and 1980s helped drive growth, but economic recovery, manufacturing excellence in the 1990s became larger drivers as cleanup markets topped out. Exports comprise about 10% of the total market, concentrated in air, water equipment. Global growth draws on resources.
Some Service Sectors Declining; Water, Energy Growing Backend treatment services – remediation, hazardous waste management, analytical labs and related consulting peaked in the 1980s and plateaued. Energy and water niches, process technologies grow with demographic and economic drivers. Source: Environmental Business Journal
Market Traits (Growth, Size) Affect Financing Options • Different market traits – growth rate, competitive dominance, nature of purchasing decisions – call for different financing approaches, incentives. • Clean energy and instruments offer much higher growth rates (>20% per year) to allow recovery of equity investments (Group A). • Larger markets, like water treatment and resource recovery with steadier growth rates, that match the economy and demographic trends, allow for some debt funding and project finance, often with some public finance (Group B). Municipal ownership is high in these sectors precluding venture capital. Tax exempt bonds, international lending are more typical. • Declining markets, like remediation and consulting, must rely on asset conversion, e.g. brownfield development or facility turnaround, to generate returns since losses on operations are common (Group C). • For international markets, project debt financing is a paramount factor since markets and enforcement mechanisms are not well-developed.
U.S. Enviro Markets 2010 Forecast: Growth vs. Size (I) • Small markets growing faster: Process Technology, Instruments, Energy, Water • Large markets growing basically with the economy: Infrastructure, Services • Shrinking markets: Traditional backend Cleanup and Remediation Source: EBI
U.S. Enviro Markets 2010 Forecast: Growth vs. Size (II) • Small markets growing faster: Process Technology, Instruments, Energy, Water • Large markets growing basically with the economy: Infrastructure, Services • Shrinking markets: Traditional backend Cleanup and Remediation Source: EBI
Drivers & Multi-media Linkage • Even with changeover in Congress, traditional environmental legislation is on a slow track (e.g., no RCRA, Superfund bills). • High market segment growth (>2x-3x GDP) drives returns needed to recover costs and risks of technology innovation. • Many environmental sectors are mature and driven by GDP and demographics: water resources, solid waste, land use. • Back-end cleanup, e.g., remediation, air, hazardous waste, are not high growth niches. Much work has been completed (USTs). • Redevelopment of aging infrastructure is becoming a bigger driver, including energy and grid, water, urban transport, gov’t. • Interest rates are low, allowing ample financing for infrastructure. • Water shortages have appeared, but have not triggered large scale budget increases yet, which will be needed for innovation. • Linkage: Innovative energy technologies look to be a high growth niche, creating higher water demands, affected by GHG policy. • Regulatory uncertainty freezes investment and market growth. • Better long-term policies mobilize more private capital.
U.S. Regional Differences Remain Sharp into 2008 Difficult to frame national solutions when country remains divided. • Sharp regional differences drive water resource and environmental policies, led by Governors / states: • Energy use patterns, electricity prices, and transmission constraints • Levels of urbanization, air pollution, vehicle use • Availability of renewable resources (hydro, biomass, wind, solar) • Water use and supply, and agricultural (“CAFO”) priorities • Land use management and pressures for suburban development • Political leadership at state and local level will differ from federal agencies regardless of party affiliation. • Priorities for urban states diverge from suburbs and rural states. • Federal policy (e.g., EPA, FERC, DOI) and funding of key programs will struggle to balance regional priorities. “Producers” vs. “Consumers”. • Hurricane recovery, climate change will aggravate regional differences.
Red States Petrochemicals & NASCAR! Producer states: Opportunities for expansion of energy infrastructure (pipelines, LNG) Roads & suburbs; SUVs, soccer Transportation and siting projects More energy exploration State PUCs approve “clean coal” plants (with scrubbers, CCS) Water + drought management Real estate development and more access to federal lands Blue States High-tech & Hockey User states: Need upgrades of energy infrastructure: pipelines and transmission, urban load Mass transit, traffic congestion Hybrids and “clean fleets” More EE, “green energy” policies More lawsuits on coal power plants (feud over NSR) Water infrastructure makeovers “Restoration Economy” and land use conservation States: “Red” (Bush) vs. “Blue” (Gore/Kerry) Different regions, different policies Different priorities will alter market and technology opportunities.
B. Race for President: 2008 Outlook Late Bulletin (from The Onion)… • Bill Clinton: 'Screw It, I'm Running For President' February 20, 2008 | Issue 44•04 CHARLESTON, SC—After spending four months accompanying his wife, Hillary, on the campaign trail, former president Bill Clinton announced Monday that he is joining the 2008 presidential race, saying he "could no longer resist the urge.“I have to.“Clinton told reporters Tuesday that seeing so many "Clinton '08" posters "really got [him] thinking," and said that the fact that he was already wearing a suit, and smiling and waving on the campaign trail was an added motivator. "My fellow Americans, I am sick and tired of not being president," said Clinton, introducing his wife at a "Hillary '08" rally. "For seven agonizing years, I have sat idly by as others experienced the joys of campaigning, debating, and interacting with the people of this great nation, and I simply cannot take it anymore. I have to be president again. He continued, "It is with a great sense of relief that I say to all of you today, 'Screw it. I'm in.'" Bill Clinton then completed his introduction of Hillary Clinton, calling her a "wonderful wife and worthy political adversary,". Poll: Many Americans Still Unsure Whom To Vote Against
2004 Result: “Red” (Bush) vs. “Blue” (Kerry or Gore) The U.S. remains sharply divided after 2004 election…in Congress also. Result in 2000 Bush: 271 Gore: 267 Result in 2004 Bush: 286 Kerry: 252 2000 Census + 7 for red Only +8 shifted, net http://www.2001inaugural.com/2000-election-map.html
2008 Election is the Democrats to lose… DemsGOP States Won in 2004 19+DC 31 Results in 2004 252 286 Total Electoral Votes Needed 270270 Likely switches in 2008: OH, IA +27 -27 More shifts in 2008 ?: MO, NM, NV, VA+39-39 Possible Result for 2008: 318220 Alternative Scenario: Puts Election in New House [Each state gets 1 vote] Results in 2004 252 286 Likely switches in 2008: OH + IA = + 27 279259 McCain counterpunch: WI or MN = -10 269269 (or GOP keeps OH, but loses IA, NM, WV)
2004 Results with Voting Tendencies The electoral battle will be focused on just a few “edge” states. There are plausible scenarios for a tie: 269 – 269 in EC. Dems: IA+NM+NV Dems: OH +IA, less MN or WI http://www.electoral-vote.com/
Democrats: Republicans: Huge momentum and turnout. “Yes we can” rivals March Madness Blue Victory: Low GOP turnout with “liberal” nominee, GOP suffers all over. GOP surprise: Democrats lose some voters in struggle for nomination. McCain pulls in OH, PA, WI. Elevated turmoil in Gulf region brings security issue back. Democrats Divided Gov’t: Clinton unites Conservatives. McCain garners Independents 3:2. Dems keep Congress. Outrage: “Million Voter March”. Black vote stays home. Chaos. UPDATE: Scenarios for 2008 Face-off SCENARIOs 70% A) “Camelot restored” Obama wins out, Hillary loses (not chosen VP) 25% B) “We Were Soldiers” Obama survives against Hillary -- doubts emerge. Economy holds up. 5% C)“There will be Blood” Clinton selected by Super Delegates – Obama leads protest (Chicago 1968 ?)
Obama Surges after Super Tuesday Open Market Trading (4/12/08) on “Presidential Futures” (Iowa Biz) Hillary rallies in N.H. Obama wins Iowa 80% Establishment Democrats break for Hillary Obama on fire in Super Tuesday Obama internet money train kicks in 20%
Outlook on Carbon Policy: 2009+, not 2008 • Differences are wide just between Democrats in House vs. Senate. • Regional differences are significant, creating winners and losers. • Recall: Clean Air Act took 12 years (to 1990) – consensus is difficult. • House is less responsive to international pressure vs. district issues. • “Pay-as-you-go” rules in House pose a real fiscal challenge. • Curbing oil and gas tax benefits to create funds is not easy. • Possible opportunity with expiration of RE credits at end of 2008. • Industry not enthusiastic about carbon funds going to Treasury. • Allocating carbon allowances creates a huge battle. • Next White House will be more disposed toward a climate bill, no matter what happens in presidential election, but terms vary. • Democrats will pick up seats in House and Senate, so environmental groups already see they can get a better carbon reg deal in 2009. • Wildcards: More storm damage, oil supply disruptions, heat wave or drought aggravating electricity prices, a terror attack in Gulf.
Challenges ahead in framing carbon policy…Poor planning, not everyone on same page
C. Energy & Carbon Policy Outlook EIA recently raised its forecast for more coal use in the wake of rising natural gas prices.
Crisis Drivers Situation Briefing: U.S. Energy • Declining on-shore U.S. oil production for three decades • Moratoriums intensified for off-shore drilling (e.g., Florida, California) • Tighter regional clean air regulations in major urban areas • Currently importing >60% of oil consumption, most of it from unstable – or even hostile regimes, who explicitly limit supply • Very grave terrorist threats at supply sources or choke points (2/26/06) • Steady erosion of global swing capacity of oil production and refining • No new refineries built in U.S. since 1976; (just expansion at sites) • Balkanized gasoline markets: 11 formulas in 3 grades = >30 fuels • Global oil consumption hit a record high in 2007: 84 M bbl/day • Substantial local resistance to more LNG capacity • Demand driven by weather, commuting patterns, growth… not price • Carbon regulations on the horizon, but very uncertain terms and timing Therefore: Energy Security & Reliability >> End-use Market Pricing
After Supreme Court Ruling, no turning back All blue states • Mass v. EPA – “ripple effect” • 1. States have standing • 2. CO2 is a pollutant under CAA • 3. EPA must determine harm • GHG regulation is coming – no longer if but: • What will it look like? • When will it happen? • Whom will it effect? • Energy from fossil fuels, remains the dominant source: who will pay ? Key Players Massachusetts et al. v. EPA(U.S. Supreme Court Case No. 05-1120) Petitioners: the Commonwealth of Massachusetts, the states of California, Connecticut, Illinois, Maine, New Jersey, New Mexico, New York, Oregon, Rhode Island, Vermont, and Washington, the District of Columbia, American Samoa Government, New York City, Mayor and City Council of Baltimore, Center for Biological Diversity, Center for Food Safety, Conservation Law Foundation, Environmental Advocates, Environmental Defense, Friends of the Earth, Greenpeace, International Center for Technology Assessment, National Environmental Trust, Natural Resources Defense Council, Sierra Club, Union of Concerned Scientists, U.S. Public Interest Research Group. Respondents: the U.S. Environmental Protection Agency, the Alliance of Automobile Manufacturers, National Automobile Dealers Association, Engine Manufacturers Association; Truck Manufacturers Association, CO2 Litigation Group; Utility Air Regulatory Group, and the States of Michigan, Texas, North Dakota, Utah, South Dakota, Alaska, Kansas, Nebraska, and Ohio.
Projected CO2 Emissions, 1990 – 2030 “Major Emitters” (Top 10) matter most. U.S.+China = 50% in 2030 Kyoto signers were 55% in 2002; but will only be 35% in 2030. 1990 2010 2030
Crisis Drivers “Where are the U.S. CO2 Emissions” Baseline: U.S. CO2 Emissions by Sector, 2000 Power sector drew early attention, but transportation is crucial also. Source: EIA, AEO 2003 Difficulty in dealing with transport sector emissions plagues EU as well. Electricity broken out by end-use sector.
Crisis Drivers EIA: U.S. CO2 Emissions by Sector, 2010 rev EIA trimmed emission projections only a bit due to higher gas prices. Source: EIA, AEO 2008
Crisis Drivers EIA: U.S. CO2 Emissions by Sector, 2030 EST Absent a massive turnover in equipment, CO2 emissions keep rising. Source: EIA, AEO 2008 Coal fired electricity continues to rise in total because of higher gas prices. Electricity broken out by end-use sector.
Crisis Drivers Driver: “Life, Liberty & Pursuit of Happiness” Public transit use peaked in 1946, when Americans took 23.4 billion trips on trains, buses and trolleys, said Donna Aggazio, spokeswoman for the American Public Transportation Association. By 1960, it dropped to 9.3 billion, and it declined further as roads and car culture gripped the nation. In 1972, transit ridership hit rock bottom at 6.5 billion trips. Since then, it seesawed until 1995, when it began steadily climbing. Ridership in 2007 reached 10.7 billion trips. In U.S.:DriversVehicles 1960 87m 74m -13m 1980 145m 156m +11m 2000 190m 220m +30m Mass Transit ridership: 10b trips, rising slowly
Crisis Drivers Prices falling Prices rising Per capita use steady 1980s 1990s 2000s Consumer Energy / Electric Use NOT based on Price “Getting the carbon price right” is more important to investors than consumers Price signals are not effective in driving consumption, but do affect investment.Lifestyle, weather, sprawl are bigger factors. New York Times, March 30, 2007 Drivers Shrug as Gasoline Prices Soar … As Americans enter the sixth year of rising oil and gasoline prices, their shift in driving habits this time has been much less extensive. What’s more, in recent weeks, gas consumption has gone up, not down, and drivers are changing their daily driving habits only slightly. “I don’t think about gas prices at all,” said Michael Machat, 48, a lawyer in West Los Angeles, where gasoline prices are among the highest in the country. As he filled up his BMW with super unleaded at $3.39 this week, he added, “I guess maybe if it was $10 a gallon, I’d think about it.” A recent study that Christopher Knittel, an economics professor at the University of California, Davis, helped write showed that every time from November 1975 to November 1980 that gasoline prices went up 20 percent, consumers changed their driving behavior by cutting gas consumption by 6 percent per capita nationwide. But from March 2001 to March 2006, drivers reduced consumption just 1 percent when prices rose 20 percent. Prices swung up and down seasonally during both periods, but Mr. Knittel said the two periods were comparable because regular gasoline prices increased in both periods by about 66 percent, to $2.50 from $1.50 in real terms, set at 2000 dollars.
Crisis Drivers Transportation Sector Vital, but Difficult with Growth “I am proposing $1.2 billion in research funding so America can lead the world in developing clean, hydrogen-powered automobiles.” President Bush, Jan. 2003 “We have a serious problem: America is addicted to oil.” President Bush, Jan. 2006 FORD HYBRID TOYOTA PRIUS • EPAct 2005 • Biofuels Standards and tax subsidies • Loan Guarantees for fuel plants and Auto manucturing facilities
EIA: Energy Trade Balance… Unsustainable EIA: Monthly Energy Review, March 2008 Energy imports aggravate the US trade balance deficit. Hitch: recession related to 9/11
Curbing Carbon Emissions is Smart Anyway… • Resource reserves: We are using up resources within several decades that took millions of years for the planet to generate. Fossil fuel resources are NOT renewable. Conservation is vital. • War & Terrorism: Because of where fossil fuels are located, rising prices end up providing funds for terrorist networks. Some believe resource wars are already underway… again (See Human History). • Water: Oil and chemical spills threaten vital water supplies and wildlife; mercury from coal accumulates in lakes and streams. • Urban pollution: As humans increasingly live in cities pollution from burning fossil fuels is killing us with pollution and vehicle accidents. • So, curbing fossil fuel use or finding more innovative ways to utilize it efficiently without causing damage to our air and water makes sense. • This will require multiple decades (two generations) to complete a transition to an economy based on low-carbon sources.
EPRI “Carbon Constrained” Scenario for Electricity Reaching lower carbon goals requires many technologies: EIA Base Case 2007 * Achieving all targets is very aggressive, but potentially feasible.
U.S. Electricity Sources (2006) – over 24 hours Natural gas accounts for most growth since 1990; overall demand +33% 4,038 TWh
OUTLOOK ON U.S. CLIMATE POLICY TIMING: UTILITY EXECS (2007) Challenge: New capacity is needed before federal legislation is expected to be resolved and litigated. themselves Source: Survey by GF Energy of Utility Executives in North America, April 2007
Opportunity Built on Princeton CMI Wedges “Stabilization Wedges: Solving the Climate Problem for the Next 50 Years with Current Technologies” “Carbon emissions from fossil fuel burning are projected to double in the next 50 years (Figure 1), keeping the world on course to more than triple the atmosphere’s carbon dioxide (CO2) concentration from its pre-industrial level. In contrast, if emissions can be kept flat over the next 50 years (orange line), we can steer a safer course. The flat path, followed by emissions reductions later in the century, is predicted to limit CO2 rise to less than a doubling and skirt the worst predicted consequences of climate change.” Robert Socolow, Steve Pacala in Science (Aug. 2004) Figure 1 “Keeping emissions flat for 50 years will require trimming projected carbon output by roughly 7 billion tons per year by 2054, keeping a total of ~175 billion tons of carbon from entering the atmosphere (yellow triangle). We refer to this carbon savings as the “stabilization triangle.”
Technology Vital to Business Opportunities “Stabilization Wedges: Solving the Climate Problem for the Next 50 Years with Current Technologies”
Carbon Cap from Various Proposed Bills Several bills call for moving below 1990 levels by 2030 or sooner.
How’s Europe doing on Carbon Emissions ? Recent economic growth and transport fuel use is reversing early GHG savings from economic contraction and shift from coal to gas.
How’s Europe doing on Carbon Emissions ? Recent economic growth and transport fuel use is reversing early GHG savings from economic contraction and shift from coal to gas. Early savings in Germany have been in shutting down massive inefficiencies in old East German facilities and shifting to gas.
Turmoil in EU Carbon Market (May 2006) Public sector “gaming” Europe hopes to avert a false economy in carbon By Fiona Harvey, June 28 2006 19:38 | Financial Times of London “What came close to putting the scheme on life support was data released between late April and mid-May which showed that last year – the first the scheme had been in operation – businesses covered by it had been given more permits than they needed because member states had overestimated demand.” Several EU states over estimated the allowances they might need as economic growth and demographics came in below projections, and national bureaus also wanted to create “headroom” in their estimates for their industry to reduce the impact of carbon compliance costs. Lower future demand for allowances led to a sudden selloff. http://www.ft.com/cms/s/b03dbc7a-06cf-11db-81d7-0000779e2340.html
UK Regulator (FSA) Posts Risks on Carbon Trading The next “credit” crisis: carbon credits ? (March 2008) • U.K. FSA lists risks of carbon trading: • The Financial Services Authority does not govern the carbon market but the watchdog listed risks in a report on carbon regulation this week: • The lack of links between emissions trading markets globally; • Some companies authorized for other financial markets may have misled customers by citing FSA authorization; • Unsuitable products being sold to investors, which could "potentially lead to damage to consumers or to disorderly trading, and a lack of confidence in market"; • The potential lack of appropriate experience among practitioners; • The quality of information available about emission quantities and allowances; • The lack of market liquidity. • (also on p.A1 of WSJ, April 12, 2008) UK watchdog warns on carbon trading / March 2008 By Fiona Harvey and Ed Crooks Published: March 31 2008 22:05 | Financial Times of London The fast-growing market in carbon dioxide emissions poses risks that could threaten other commodities markets, the FSA, Financial Services Authority, warned on Monday. The watchdog said problems including investors being sold unsuitable products, confusion over the regulation of emissions traders, and insufficient official data created risks to both the fledgling global emissions markets and to related commodities such as gas and electricity. EU traders in fossil fuels and electricity, for instance, factor carbon permit prices into their deals, which can hit consumers. “Cap and trade” systems, which place a limit on the amounts of carbon that companies produce, are widely seen as one of the most promising ways of curbing greenhouse gas emissions at the lowest cost, and have been embraced since 2005 by the EU. In the EU the market is regulated by the European Commission. The FSA does not have a direct hand in regulating the market, and said it had no plans to do so. But it said in a paper published on Monday that “the emissions markets justifiably demand the FSA’s continued attention”. The emissions markets have been beset by difficulties, for example in 2006 when it was revealed that more carbon permits had been issued for the first phase of the EU’s scheme than were needed. This led to a steep fall in the price of the permits. Among problems cited by the FSA is that some companies authorised for other financial markets may have misled customers by citing their FSA authorisation in relation to carbon trading. The paper warned: “Aside from being misleading and leading to potential enforcement action, this type of behaviour undermines confidence in the market.” There was a strong reputational risk to the carbon market from unsuitable products being sold to investors, the FSA said. http://www.ft.com/cms/s/b03dbc7a-06cf-11db-81d7-0000779e2340.html
$7.6? $7.1 EPA Budget Declining… not funded to regulate CO2 Budget Challenge in USA for U.S. EPA Source: EPA Budget in Brief, 2009 The Game: White House OMB cuts state water grants and earmarks, knowing Congress will restore them. Congress will likely boost climate budget also… in 2010.
EU is committed to a cap because: They can’t harmonize 27 national tax systems (social contracts) A cap is a policy mandate needed to prop up coalition parliaments They need CDM as a means to channel funds to emerging nations They are shifting from coal to gas, with market pricing of electricity, rather than regulated pricing EU economies face demographic decline, and are stagnant EU is casting energy security on Russian/FSU gas, and they want to tax profits from fossil economy – some interest in coal with CCS. USA can choose and engage Asia: We have a common federal tax system (and clever tax lawyers) State incentives can supplement and help tailor approaches U.S. will be at 50% coal for power, and China, India are using more coal USA and Asia are still growing ! But, U.S. growth is concentrated in “Red” states; …“Blue” states are older, colder and losing young people Asia leads in building new reactors and we have big stake in nuclear for national security… and GHG gains Our future requires baseload and RE, including PHEVs (electrify transport) Smart Policy ? Drivers in EU vs. USA… and how to engage Asia ?
Smart Policy WBCSD Module: Pathways to 2050 World Business Council for Sustainable Development Pathways to 2050 - Energy and Climate Change Pathways to 2050 - Energy & climate change builds on the WBCSD’s 2004 Facts and Trends to 2050: Energy and Climate Change and provides a more detailed overview of potential pathways to reducing CO2 emissions. The pathways shown illustrate the scale and complexity of the change needed, as well as the progress that has to be made through to 2050. Our “checkpoint” in 2025 gives a measure of this progress and demonstrates the urgency to act early to shift to a sustainable emissions trajectory. The WBCSD has chosen to continue to illustrate the challenges associated with one particular trajectory, consistent with the discussion already presented in Facts and Trends ( 1.9 MB). This document therefore looks closely at the changes needed to begin to stabilize CO2 concentrations in the atmosphere at no more than 550-ppm (see glossary), which relates to the “9 Gt world” described in Facts and Trends. As such, and based upon simplified assumptions and extrapolations, we have made many choices, some arbitrary, to present this single illustrative story. It is neither a fully-fledged scenario nor does it recommend a target. Moreover, this document does not discuss policy definitions or options, topics that need to be dealt with separately. www.wbcsd.org
WBCSD: Opportunity starts at national / sectoral level B. National/Sectoral Goals & Targets Efficiency Buildings Industry xx % p.a. Domestic through to 20xx Power Renewables xx MW p.a. by 20xx Generation CCS xx tonnes CO2 p.a. Mobility Bio-fuels xx litres p.a. by 20xx Efficiency xx mpg by 20xx Choice Hybrid / Diesel uptake Mass transit C. National Policies Buildings – adopt new country building standards, design awareness Industry – Sectoral agreements, emissions trading, technology standards Domestic – carbon labeling, increased product standards (e.g. standby energy) Renewable Energy – renewables targets. CCS – funding for infrastructure, tax cuts on capital investments, price signals for carbon via emissions trading Biofuels – targets, support for manufacturing, CO2 labeling Vehicle Efficiency - support technology, incentives, sectoral agreements Mobility Choice - consumer incentives, promote public/private partnerships for transport networks A. Opportunity Wedges (National) (Developed Country Example) CO2 Emissions, MT per annum National CO2 trajectory
GHG markets are expanding globally CDM evolves to includes sectors Linkages develop between all systems and more systems appear CDM Japan technology standards Canadian LFE-ETS Expanding EU-ETS EU-ETS US NE-States ETS Danish-ETS California vehicle CO2 & ETS UK-ETS Australian states ETS 48 2000 2005 2010 2015 2020 2025 Pre-Kyoto Kyoto Linkage framework is implemented
A future framework – What is needed? 49 • A long-term goal (>2040)… geared to capital markets • Established by 2010 • Described in terms of carbon equivalent emissions • Technology development and deployment framework • Expanded support for R&D • Global standards • Technology transfer driven by standards • Risk management • Emissions management at national and sectoral level • Bottom-up approach aligned with energy policy • Sector by sector • Expanded project mechanism • Progressive inclusion of all countries • Linkage framework to encourage international trading