Download
1 / 11
290 likes | 777 Views
pV Diagrams. Volume Change : confined gas. Work = (Force)( displacement). = (pressure x Area)( displacement). = (pressure)( volume). Work = Force displacement. W>0. W<0. p -V Diagram. work done = area under p -V curve. Thermodynamic state.

E N D
Volume Change: confined gas Work = (Force)(displacement) = (pressure x Area)(displacement) = (pressure)(volume) Work = Force displacement W>0 W<0
p-V Diagram work done = area under p-V curve
Thermodynamic state When a system is at equilibrium under a given set of conditions, it is said to be in a definite state. For a given thermodynamic state, many of the system’s properties have a specific value corresponding to that state.
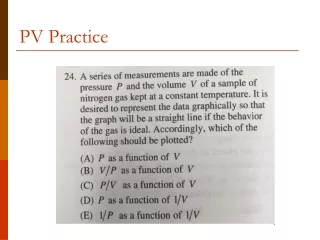
Example Through which path is the work done in getting from state 1 to 2 least?
Thermodynamic Process • a process in which there are changes in the state of a thermodynamic system • ISOBARIC – constant pressure • ISOTHERMAL • – constant temperature • heat flow slow enough that thermal equilibrium is maintained
ADIABATIC – no heat transfer • insulation • very quick process • ISOCHORIC – no work done • fixed volume • rigid walls • “free expansion”
Internal energy is a state function • function of state coordinates (p,V,T) • a thermodynamic system in a specific state has a unique internal energy that depends only on that state * cyclic process
cyclic process Q = U + W *system goes back to initial state U=0 Q = W
Example The pV diagram shows a cyclic process. It starts at point a, proceeds counterclockwise to point b, then back to a. The total work is –500 J. • Why is the work done negative? • Find the change in internal energy. • Find the amount of heat transfer involved