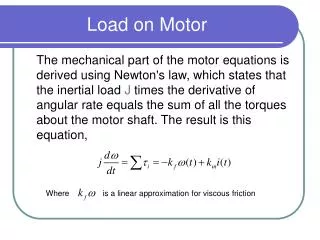
Vibration analysis through motion control-motor-load interaction
210 likes | 359 Views
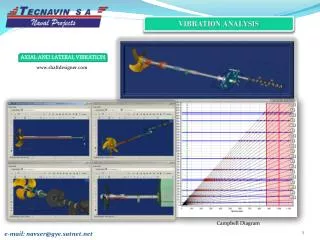
Vibration analysis through motion control-motor-load interaction. Example of Motion Control-motor-load. Transmission. PID Controller. Motor. Load. 250 Hz. PID Controller bandwidth measure. The controller bandwidth has been experimental found.

Vibration analysis through motion control-motor-load interaction
E N D
Presentation Transcript
Vibration analysis through • motion control-motor-load • interaction
Example of Motion Control-motor-load Transmission PID Controller Motor Load
250 Hz PID Controller bandwidth measure • The controller bandwidth has been experimental found. • In particular has been applied a TORQUE STEP to the pulley. Torque step (signal) PID bandwidth (FFT)
Torque step • The torque step is an approximation of a Dirac impulse thus a infinite frequency generator. The Torque step excite the mechanical system with a very wide band. • Only for certain control system it’s possible to apply a software Torque step. • If it isn’t available a software Torque step, we can obtain a similar result with a quick hammer hit on the pulley. The tangential hammer hit on the pulley has the effect of a Torque step on the motor shaft.
250 Hz • The software torque step is a better approximation of a Dirac impulse. It has a wider harmonic content (it contains higher frequencies and so excites the system at higher frequencies. Software Torque step Hammer Torque step
Motion control response to Torque step • The controller reacts to the pulley displacement, with a correction signal which has all the available frequencies and shows his bandwidth. • The 2 types of torque step has been applied on 2 different control system with different bandwidth. • It’s however useful to observe the Torque step responses of 2 different control system.
250 Hz • Frequency analysis of software Torque step response • Frequency analysis of hammer test response • We can see multiple peaks with 6-7 Hz width. This behaviour is the FFT of a step; it shows the forcing action on the system (Torque step) that has an effect on the output (controller response).
Link between bandwidth and PID parameters • The controller bandwidth depends on PID gains. We can obtain the bandwidth from transfer function (mathematical model) of the controller in which appear PID gains. • In particular if we increase the PROPORTIONAL gain, the control becomes much ready, it reacts quicker to errors and his bandwidth increases. • The sinusoidal signal with high frequency has a quicker rise and then correct errors in a short time (of position, velocity or torque depending on PID structure and which gain has been modified).
First Peak Second Peak Third Peak In the picture below we can see that increasing proportional gain the bandwidth increases. We can see 3 different great peaks due to many PID that interacts. We can also see that the area below the 2 curves is equal; it depends on drive’s energy that is constant (it depends from the input voltage). In High P-gain case we have higher amplitude at high frequencies because the bandwidth “cover” the resonance frequency of the system and ignite a vibration.
Vibration analysis • After a vibration problem on servomotors we have elaborated a model to simulate the group motion control-motor-load. • The vibration analysis has been divided in: • ignite of vibrations on motor+load; • experimental measures; • result analysis through FFT (Fast Fourier Transform).
Ignite of vibrations • The vibrations have been ignited increasing position proportional gain. The bandwidth increases and “cover” the resonance frequency of motor+transmission+load. • The vibration is visible on Torque feedback and position error(lag error) signals. • Tests has shown that the causes of vibrations are: • bandwidth wide enough (high gains); • profile point with jerk impulse.
Resonance peak S o c a p e l P I D B a n d w i d t h • BANDWIDTH WIDE ENOUGH • The bandwidth has been widen increasing proportional gain. • In this way we “cover” the resonance frequency of motor+transmission+load. • To obtain a vibration during the movement it would be necessary to further increase the proportional gain, with the risk to ignite too great vibrations.
PROFILE POINT WITH JERK IMPULSE • From the tests we have seen that , with high P-gain the vibration at natural frequency of motor+transmission+load, happens when there is a jerk sudden peak in the profile. • The jerk impulse is similar to the Dirac impulse and, as the Torque step, excites the system natural frequency and ignite the vibration.
Jerk impulse and vibration Jerk impulse i.e. excitement of natural frequencies Natural frequency of motor+transmission+load at 100 Hz
Frequency analysis • It’s necessary to underline that the theoretical Fourier transform is an integral on a infinite time interval of a continuous function. • Acquired signals, instead, are digital and so discrete. We can’t use the Fourier transform but the FFT (Fast Fourier Transform) which can be applied to discrete signal with finite length. • Considering that , the max computable frequency is related to minimum period and so to sample time.
3D FFT GRAPH • The Fourier Transform is born for periodic signal. The real signals aren’t periodic because they become from measures. • The Fourier Transform (called in this case STFT Short Term Fourier Transform) is then different if we consider a part of signal or another. • If we have a signal of 10s, for example, if we analyse the first or the eighth second is different. If we analyse all the 10 seconds we obtain all the characteristic frequencies each other superimposed.
If we have elaborated mechatronic system, with complex motion profiles, the geometric configuration and the mass and forces distribution changes during the movement. • For the jaw system of Filling Machine A3/Flex, for example, the load (the mass) is distributed on the 4 axis in a different way if we have closed or opened jaws. • It’s important to understand if only certain frequencies becomes resonant only in certain profile points and why. Motion Control for Packaging Machines
To do the FFT in time of a signal, we take windows (which can be of different types) and we do FFT in each window. • Placing side by side the results of the windows we obtain a 3D graph which has: • amplitude on z axis • frequency on x axis • time on y axis z y x
Motor+ Transmission+ load resonance peak Belt axial natural frequency at 300 Hz (as found by the model) PAM 250Hz Bandwidth Example of a FFT of a mechatronic system with belt Motion Control for Packaging Machines