Download
1 / 21
210 likes | 325 Views
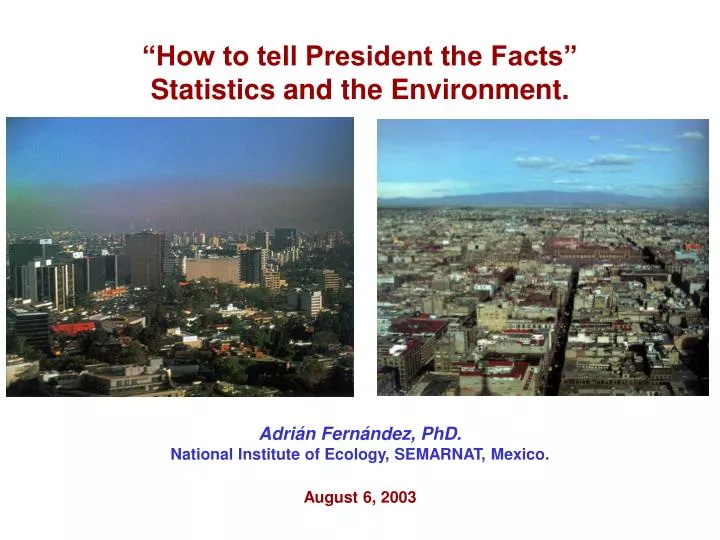
“How to tell President the Facts” Statistics and the Environment. Adrián Fernández, PhD. National Institute of Ecology, SEMARNAT, Mexico. August 6, 2003. Mexico City population at risk: 20 million inhabitants, including: 2.2 million children 250,000 street sellers

E N D
“How to tell President the Facts” Statistics and the Environment. Adrián Fernández, PhD. National Institute of Ecology, SEMARNAT, Mexico. August 6, 2003
Mexico City population at risk: • 20 million inhabitants, including: • 2.2 million children • 250,000 street sellers • 250,000 taxi, microbus and bus drivers • More than 30 million trips-person are made every day • People spend in average 3 hr commuting per day; • 20% of commuters spend 4 or more hours • CO, PM, VOCs and NOx exposure levels are 2-3 times • higher in commuting microenvironments than at • fixed site monitoring stations
Annual average concentration Dowtown (Merced) monitoring station CO (ppm) Lead (g/m3) SO2 (ppm)
Main reasons for air quality improvement 1990-1999 Lead • Unleaded gasoline introduced in 1990 • Leaded gasoline completely phased out in 1997 • Average blood lead levels dropped from 20 ug/dl in the late 1980s to less than 10 ug/dl in the late 1990s Sulfur Dioxide • Industrial heavy fuel oil was phased out in mid 1990s • Sulfur content of diesel was reduced to 0.05% in 1995 • Power plants and other industry shifted to natural gas in the early 1990s
Annual average concentration Downtown (Merced) monitoring station Ozone (ppm) PM10 (g/m3) NO2 (ppm)
Number of days with ozone above 100, 150, 175, 200, 225, 250 and 300 AQ Index Points
Ozone annual peaks in Mexico City and the South Coast * Tlalnepantla (TLA), Xalostoc (XAL), Merced (MER), Pedregal (PED) y Cerro de la Estrella (CES)
Tailpipe emissions of CO in g/l FTP-75 cycle tests Tests on 36 vehicles of 4 technological strata
Evolution of vehicle emissions through three Remote Sensing Campaigns • Several thousand vehicles were measured in each campaign • Most of monitoring points were the same • Average age of measured vehicles was 8 years • *IMP, Study commissioned by CAM • **Bishop, Stedman, Dávalos, De la Garza (1977) • *** Beaton, Bishop, Stedman (1992)
Comparison of USA and Mexican Standards Tail-pipe emissions in g/km HC CO NOx US emission limits 1972 2.2 24.2 NR 1975 0.94 15.0 1.94 1978 0.94 15.0 1.25 1981 0.25 2.1 0.62 1994 0.16 2.1 0.25 Mexican emission limits (0 km) 1975 2.5 29.2 NR 1977 2.6 24.2 2.2 1988 2.0 22.2 2.3 1990 1.8 18.0 2.0 1991 0.7 7.0 1.4 1994 0.25 2.1 0.62 2001* 0.16 2.1 0.25 * These emission levels were met in 1999 through a “voluntarily” agreement .
100% 90% 80% 70% 2000-2010 60% 93 - 99 50% 84- 92 40% 83 & earlier 30% 20% 10% 0% 1990 1995 2000 2010 Rational for taking action with new cars
Background for the TIER I negotiations (1) • In 1997 INE started negotiations with Car Manufacturers Association (AMIA) to review standards for new vehicles • Standards in México were similar to those applied in the US for 1981-1993 vehicles • The difference in NOx emissions between a 1997 Suburban and a Cavalier was 7:1 (1.2 g/km vs 0.17 g/km, TIER I standard was 0.25 g/km) • AMIA´s position: earliest possible date to meet the new standards TIER I (EPA 1994) was 2001
Arguments stated by AMIA members in 1997: • Regulatory efforts should concentrate only in old cars • Altitude played an important role • Gasoline quality was a serious problem (sic) • Costs for meeting TIER I (EPA 1994) will be too high • Earliest possible date for TIER I = 2001
Creating value: the 2-year exemption of the vehicle inspection program • Current federal standards mandate an inspection for all vehicles twice a year, irrespectively of age and model. I/M annoys people, and there is a risk of failing the test • INE proposed to CAM a voluntary standard: “1999 & 2000 vehicles meeting TIER I (instead the obligatory target of 2001) would obtain a 2-year I/M test waiver • Key issue: the scheme would generate competition, because some vehicles were already TIER I while others were not. Consumers would have more choices • Result: all 1999 vehicles met the ”voluntary” standard
Emission levels of some 1998 & 1999 models Hidrocarbons Nitrogen oxides Carbon monoxide g/km g/km g/km 1.6 7 0.5 1.4 6 0.4 1.2 5 1 0.3 4 0.8 3 0.2 0.6 2 0.4 0.1 1 0.2 0 0 0 1998 1999 1998 1999 1998 1999 Silverado Ram 1500 Ram 2500 Jeta Sedán Combi Panel Pickup larga Nissan Suburban
In May 2000 INE told the media that the I/M waiver would be cancelled because authorities had no news from AMIA The following week AMIA sent a proposal to INE and went back to the negotiations table
Comparison of emissions: Prius vs VW Taxi Considering: about 200 km driven per day, 60,000 km per year The annual emissions of 1 taxi are equivalent to: Emissions of 147 Prius for CO, 74 for NOx, 71 for THC, and 2 for CO2 Fuel savings are around US $2000 - 2500 per year.
Fuel efficiency of passenger vehicles comparable to the hybrid vehicle Prius (model-year 2002) Source: Mexican Automotive Manufacturers Association & CONAE (www.conae.gob.mx) * These values were obtained under laboratory conditions