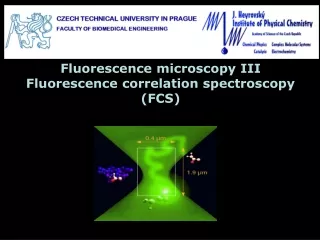
F luorescence Correlation Spectroscopy
F luorescence Correlation Spectroscopy. MC and Christine. An Introduction. FCS is a high-resolution spatial and temporal analysis of very low concentrations of biomolecules

F luorescence Correlation Spectroscopy
E N D
Presentation Transcript
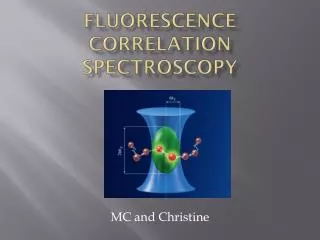
Fluorescence Correlation Spectroscopy MC and Christine
An Introduction • FCS is a high-resolution spatial and temporal analysis of very low concentrations of biomolecules • This is done by measuring the spontaneous intensity fluctuations caused by the minute deviations of the system from equilibrium
Uses • Developed in the early seventies as a way to analyze relaxation • Study the Behavior of Individual Molecules • Study Serum Biomarkers • Monitoring biological molecular association and disassociation processes
What Can You Get Out of It? • Diffusion Coefficients • Hydrodynamic Radii • Average Concentrations • Kinetic Chemical Reaction Rates
History • 1916 – Smoluchowski gave the first description of amplitude and temporal decay of number fluctuations in diffusion system • 1972-1974 – Magde, Elson, Webb published book on potential of FCS and first developed the technique at Cornell University • 1990 – Rigler reached single molecule detection limit on FCS • 1994 – Eigen and Rigler proposed dual color cross correlation for FCS • 2000 – FCS evolved and also dual color cross correlation made and used
FCS General Principles FCS is a method in which the florescence intensity arising from a very small volume containing fluorescent molecules is correlated/analyzed to obtain information about the processes that give rise to fluctuations in the fluorescence. [1]
Brownian Motion • This concept dictates the appearance and disappearance of fluorescent molecules in small observation volume. [2] http://www.realinnovation.com/commentary/archive/organizational_brownian_motion.html
Technique optimization • Small number of molecules. • Large number of molecules suppress effect of fluctuations. • Low concentration is implied by 1. • Small area or cavity. One or less molecule. • Number of fluctuations is inversely related to number of molecules.
Why low concentration? • Magnitude of number fluctuations = Mean square deviations
Typical Set up http://en.wikipedia.org/wiki/File:Fluorescence_correlation_spectroscopy_instrument_diagram.png [2]
Measurements • During FCS you measure the Fluorescent Intensity. • Data not very useful yet! • Notice that these fluctuations are caused by diffusion of fluorescent molecules through the cavity or just changes in fluorescence over time
Autocorrelation Function • Goal: to make sense out of data. OR
t For small t t For larger t g(t) t tc Recall: Intensity autocorrelation g(t) = <I(t) I(t + t)>t
Before and After Correlation • = is the average time it takes for a molecule to diffuse through radial cavity. 1/N
2D & 3D Correlation Function 3D • r and l are radial and axial dimensions of volume. • For large r/l, same as 2D.
Diffusion Coefficient • From autocorrelation plot we get N and • The relationship between diffusion time and coefficient is; • r is the radius of cavity – can be measured. • Therefore, we can find D!
Different Mobility Modes Model autocorrelation curves for different kinds of particle motion [2]
Cross-correlation curves at different time points during an endonucleolytic cleavage reaction. Dotted lines are the original data. Fitted curves are given in solid lines. During the reaction the cross-correlation amplitude, which is a measure of the reaction progress, gradually decreases.
References • Methods in Biomolecular Physics, Serdyuk and SZ² • http://www.biophysics.org/Portals/1/PDFs/Education/schwille.pdf • http://research.stowers-institute.org/microscopy/external/Technology/FCS/index.htm • http://www.invitrogen.com/site/us/en/home/References/Molecular-Probes-The-Handbook/Technical-Notes-and-Product-Highlights/Fluorescence-Correlation-Spectroscopy-FCS.html • http://vohweb.chem.ucla.edu/voh/classes%5Cwinter09%5C221AID232%5CFCS.pdf • http://www.biophysics.org/Portals/1/PDFs/Education/schwille.pdf