Advanced Boolean Analysis in Large Gene Expression Datasets for Biological Insights
This study introduces a novel algorithm to construct Boolean networks from extensive gene expression data, effectively identifying both symmetric and asymmetric gene relationships. The algorithm processes 3 billion gene pairs, utilizing data from over 9,500 microarrays across human, mouse, and fruit fly datasets, achieving results in under three hours on standard computers. The resulting networks reveal significant biological insights regarding tissue differences, gender-specific expressions, and evolutionary conserved relationships. Full Boolean relationships are accessible for exploration, enhancing our understanding of gene interactions.

Advanced Boolean Analysis in Large Gene Expression Datasets for Biological Insights
E N D
Presentation Transcript
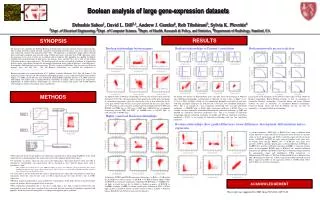
Boolean analysis of large gene-expression datasets Debashis Sahoo1, David L. Dill2,1, Andrew J. Gentles4, Rob Tibshirani3, Sylvia K. Plevritis4 1Dept. of Electrical Engineering, 2Dept. of Computer Science, 3Depts. of Health, Research & Policy, and Statistics, 4Department of Radiology, Stanford, CA RESULTS SYNOPSIS Boolean relationships between genes Boolean relationships vs Pearson’s correlation Boolean networks are not scale free We present a new algorithm for building Boolean networks from very large amounts of gene expression data. The resulting networks include not only symmetric relationships between genes, such as co-expression, but also asymmetric relations that represent if-then rules. The approach is conceptually simple and fast enough that it can build a complete gene network using 3 billion gene pairs with more than 9,500 expression values per gene-pair in less than 3 hours on an ordinary office computer. The algorithm was applied to publicly available data from thousands of microarrays for humans, mice, and fruit flies (for a total of 365 million Affymetrix probeset expression levels). The resulting network consists of hundreds of millions of relationships between genes, and contains biologically meaningful information about gender differences, tissue differences, development, differentiation and co-expression. We also examine relationships that are conserved between humans, mice, and fruit flies. The full Boolean relationships are available for exploration at http://gourd.stanford.edu/~sahoo/recomb07/ Boolean networks were constructed from 4,787 publicly available Affymetrix U133 Plus 2.0 human, 2,154 Affymetrix mouse 430 2.0, and 450 Affymetrix Drosophila genome 1 arrays from Gene Expression Omnibus (Edgar et al. 2002). All the datasets were normalized using the RMA algorithm (Irizarry et al. 2003). There are 208 million, 336 million and 17 million Boolean relationships in human, mouse and fruit fly respectively. Additionally, 4 million Boolean relationships are conserved in human and mouse and 41,260 Boolean relationships are conserved in human, mouse and fruit fly. Equivalent PTPRC low CD19 low XIST high RPS4Y1 low Opposite FAM60A lowNUAK1 high COL3A1 highSPARC high METHODS Six different types of Boolean relationships between pairs of genes taken from the Affymetrix U133 Plus 2.0 human dataset. Each point in the scatter plot corresponds to a microarray experiment, where the value for the x-axis is gene expression for the x-axis gene and the value for the y-axis is gene expression for the y-axis gene. There are 4,787 points in each scatter plot. (a) Equivalent relationship between CCNB2 and BUB1B. (b) PTPRC low CD19 low. (c) XIST high RPS4Y1 low. (d) Opposite relationship between EED and XTP7. (e) FAM60A low NUAK1 high. (f) COL3A1 high SPARC high. On human CD (clusters of differentiation) genes: this plot shows the histogram of different types of Boolean relationships. (a) Equivalent. (e) Opposite. (b) Low Low. (c) High Low. (f) Low High. (g) High High. (d) No relationships. Example scatter plots of gene pairs with their correlation coefficient. (h) COL3A1 low COL1A1 low, correlation coefficient = 0.933. This is an example of a clear asymmetric relationship with very high correlation coefficient. (i) VPREB1 high IGLL1 high, correlation coefficient = 0.7963. This is an example of a clear asymmetric relationship with moderate correlation coefficient. (j) TLR2 and ITGAM are equivalent, correlation coefficient = 0.7. This is an example of equivalent relationship with low correlation coefficient. (k) LAIR1 and WAS are equivalent, correlation coefficient = 0.5158, is an example of equivalent relationship with very low correlation coefficient. Log-log plot of the histogram of the probesets with respect to their number of Boolean relationships. Human Boolean network: (a) total, (b) symmetric, (c) asymmetric Boolean relationships. Conserved human and mouse Boolean network: (d) total, (e) symmetric, (f) asymmetric Boolean relationships. Conserved human, mouse and fruit fly Boolean network: (g) total, (h) symmetric, (i) asymmetric Boolean relationships. Highly conserved Boolean relationships Boolean relationships show gender differences, tissue differences, development, differentiation and co-expression. (a) Gender difference, XIST high RPS4Y1 low, male is different from female. RPS4Y1 is expressed only in certain male tissues because it is present solely on the Y chromosome and XIST is normally expressed only in female tissues, so RPS4Y1 and XIST are rarely expressed together on the same array. (b) Gender tissue specific, RPS4Y1 low ACPP low, only males have prostates. ACPP is a prostate specific gene. (c) Tissue difference, ACPP high GABRB1 low, prostate is different from brain. GABRB1 is expressed in brain tissue. (d) Development, HOXD3 high HOXA13 low, anterior is different from posterior. HOXD3 and HOXA13 have their evolutionary origin from fruit fly antennapedia (Antp) and ultrabithorax (UBX) respectively. (e) Differentiation, KIT high CD19 low, Differentiated B Cell is different from HSC (Hematopoietic stem cell). CD19 is expressed in differentiated B cell and KIT is expressed in HSC. (f) Co-expression, CDC2 vs CCNB2. Both CDC2 and CCNB2 are cell cycle related genes. • The expression levels of each probeset are sorted and a step function is fitted (using StepMiner) to the sorted expression level, which minimizes the square error between the original and the fitted values. • A threshold t is chosen, where the step crosses the original data. The region between t-0.5 and t+0.5 is classified as “intermediate”, the region below t-0.5 is classified as “low” and the region above t+0.5 is classified as “high”. • The examples show probesets for two genes CDH1 and CDC2. As can be seen, CDH1 has a sharp rise between 6 and 9 and the StepMiner algorithm was able to assign a threshold in this region. CDC2, however, is very linear, and the StepMiner algorithm assigns the threshold approximately in the middle of the line. • A scatter plot is shown to illustrate the analysis. Each point in the scatter plot corresponds to a microarray experiment, where the value for the x-axis is CDC2 expression and the value for the y-axis is CDH1 expression. • Boolean analysis is performed on a pair of probesets, which ignores all the points that lie in the intermediate region and analyzes the four quadrants of the scatter plot. • Four asymmetric relationships (low low, low high, high low, high high) are discovered, each corresponds to exactly one sparse quadrant in the scatter plot and two symmetric relationships (equivalent and opposite) are discovered each corresponds to two diagonally opposite sparse quadrants. Orthologous CCNB2 and BUB1B equivalent relationships: (a) Bub1 vs CycB in fruit fly, (b) Bub1b vs Ccnb2 in mouse, (c) BUB1B vs CCNB2 in human. Both CCNB2 and BUB1B are cell cycle related genes. Orthologus BUB1B high GABRB1 low: (d) Bub1 vs Lcch3 in fruit fly, (e) Bub1b vs Gabrb1 in mouse, (f) BUB1B vs GABRB1 in human. GABRB1 is a brain specific gene. Orthologous E2F2 PCNA high: (g) E2f vs mus209 in fruit fly, (h) E2f1 vs Pcna in mouse, (i) E2F2 vs PCNA in human. Both E2F2 and PCNA are cell cycle related genes. ACKNOWLEDGEMENT This work was supported by NIH Grant 5U56CA112973-02.