Download
1 / 13
130 likes | 145 Views
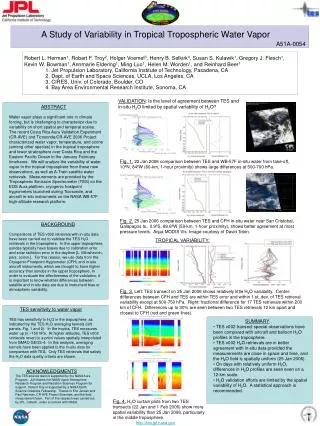
This research paper discusses the use of a GPS-based network to study small scale water vapor variability in the Southern Great Plains. The paper outlines the network overview, location, station components and operation, as well as the observations and results. It also includes simulations of tomography and presents preliminary tomography results. The paper concludes by highlighting the need for further investigation and the potential for combining GPS with other instruments to improve vertical resolution.

E N D
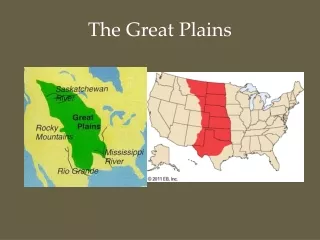
GPS Sensed Small Scale Water Vapor Variability in the Southern Great Plains John Braun and Chris Rocken
Outline • Network Overview • Network Location • Station Components and Operation • SW Observations vs PW Observations • Results • Tomography Simulations • Example 3-D Refractivity Field
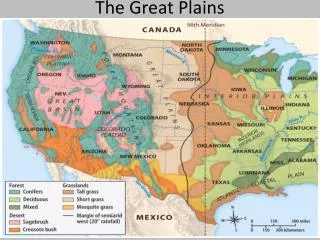
Location of Network Location of L1 network around ARM SGP Central Facility NOAA GPS network with ARM SGP Region
GPS antenna Radio modem antenna Solar Panel GPS receiver/radio modem Battery backup GPS Station Components Each station equipped with GPS receiver, radio modem, and power source. No additional infrastructure required.
Precipitable Water and Slant Water • SW can be estimated along single GPS ray paths • Simultaneous observations along 10-12 ray paths • PW is essentially an average of SW (after they have been scaled to zenith)
Volume Display of Satellite Ray Paths 5 minutes of observations at 30 second epochs
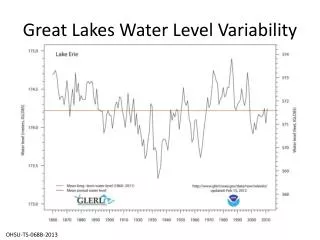
Variation in PW across Network PW deviation with respect to the total PW
Simulated Tomography Layers Tomography Estimate Input Field
Simulated Tomography Tomography Estimate Input Field
Preliminary Tomography Results 500 m layers Lowest 500 m
Conclusions • Network of 24 GPS stations installed and continuously operating • Less than 10 days of data have been lost due to logistics • More than 15 months of observations analyzed • Preliminary tomography results are encouraging • more vertical resolution needed (combine GPS with other instruments) • Specific cases need to be investigated
Acknowledgments This work was supported by DOE Atmospheric Radiation Measurement Program and NCAR Advanced Study Program