Download
1 / 12
120 likes | 254 Views
An Integrated Fire, Smoke and Air Quality Data & Tools Network. Stefan Falke and Rudolf Husar Center for Air Pollution Impact and Trend Analysis Washington University in St. Louis Brooke Hemming US EPA – Office of Research and Development Eduard Hovy Information Sciences Institute

E N D
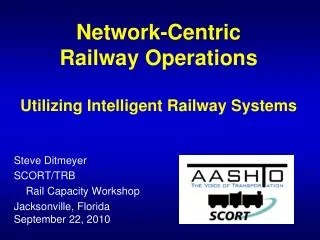
An Integrated Fire, Smoke and Air Quality Data & Tools Network Stefan Falke and Rudolf Husar Center for Air Pollution Impact and Trend Analysis Washington University in St. Louis Brooke Hemming US EPA – Office of Research and Development Eduard Hovy Information Sciences Institute University of Southern California
GAO Report Geospatial Information: Technologies Hold Promise for Wildland Fire Management, but Challenges Remain (October 2003) • Data: Geospatial data are not consistently available and not compatible across agencies • Systems: Agencies have developed multiple, duplicative systems that are not interoperable • Infrastructure: Consistent infrastructure to support geospatial data use is needed • Staffing: Inconsistencies among specialists who work with geospatial data • New products: Agencies are not aware of new technology available to them These challenges are compounded by the fact that fire management extends beyond the responsibility of a single agency http://www.gao.gov/new.items/d031047.pdf
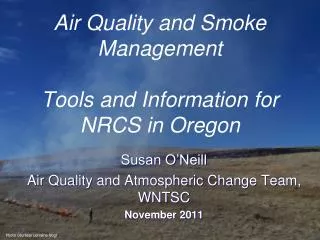
Future Fire Management Scenario National Research Council Report, “IT Roadmap to a Geospatial Future” (2003) • The wildfire hazard system automatically monitors for early detection of outbreaks • Combines satellite measurements with historical data and models • Models are run and updated in real time to determine fire extent and smoke impact • Enables real time analysis by a control team
Distributed Data Sources Numerous state, regional, and national fire related databases and online access applications exist. The challenge is to integrate them on-the-fly without requiring substantial changes to the underlying systems. Also need to access data sources that are not “Web-ready”. UMD BlueSkyRAINS NOAA USGS WFAS GeoMAC In many cases, we need to combine information from multiple sources
Demonstration Project • Objectives: To demonstrate the utility of new information technologies in creating an integrated network of data and tools for fire, smoke, and air quality management. • Link multiple existing data and tools without requiring substantial modification on the provider’s end and provide interfaces that make the links transparent to the end user. • “Add value” to the linked data through the application of web services • How can new “nodes” join the network and benefit from existing technology and methods?
Distributed Voyager Fire Data Application The fire location data (indicated by red dots) and PM2.5 concentrations (indicated by yellow circles) are accessed using data ‘wrappers’ that are linked to their respective data sources (European Space Agency and RPO-VIEWS). The distributed Voyager interface is fully described in Husar et al.: capita.wustl.edu/Voyager.
Fire Emissions and Fire History 1999 county level NEI wildland fire SO2 emissions (yellow column) 1999 county level NEI prescribed fire SO2 emissions (orange columns) 1999 BLM fire history database number of acres burned (red circles) The sizes of the yellow and orange bars are proportional to the tons of emissions in a county. The size of the red circles is proportional the number of acres burned in a fire.
Beyond Distributed Data: Web Services Substantial progress has been achieved in data interoperability. One the next advances required is interoperable data analysis/processing tools. Web services are applications that are used over the Web. Because they are self-contained and self describing, they can be reused in a variety of independent applications. Many of the analysis and processing tools used by the fire, smoke, and air quality management community could benefit from web service technology. Not only can their data be shared but their heterogeneous, distributed tools that operate on that data can be shared as well.
Spatial Interpolation Service Spatial Interpolation Service From the Voyager interface (or other interfaces), the spatial interpolation service is called. The interpolation settings are set and the input point data set is interpolated to an estimated continuous surface.
Add Local Data Service The interpolated surface contains gaps in your area of interest. However, you have some data on your local PC that is comparable and would like to include it in the map. Add Point Data Service From the Voyager interface you launch the Add Point Data Service, copy and paste your data (lat, lon, value), and add it to the map. Other web services might include: difference/ratio calculations, statistics for comparing data/models, resolving spatial and temporal scales differences, customized queries, emissions estimation …
Distributed Components and Flow Data Wrappers CAPITA BLM Fire History Export Table FS Coarse Spatial Data Fire Data Catalog GIS Interfaces NEI Fire Emissions ftp MODIS Fire Detection Wildland Fire Assessment System text tables Spatial Interpolation Local Data RDBMS VIEWS OGC Specs Geospatial One-Stop
Additional information can be found on the project’s website : http://capita.wustl.edu/FSAN Please contact Stefan Falke (stefan@me.wustl.edu) with any questions or comments.