Download
1 / 56
560 likes | 745 Views
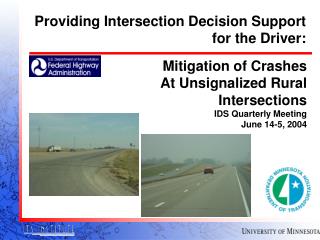
Providing Intersection Decision Support for the Driver:. Mitigation of Crashes At Unsignalized Rural Intersections IDS Quarterly Meeting June 14-5, 2004. Addressing Rural Intersection Safety Issues:.

E N D
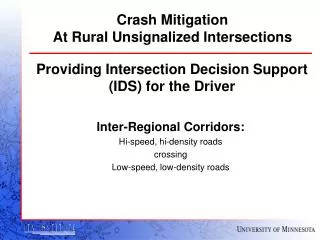
Providing Intersection Decision Support for the Driver: Mitigation of CrashesAt Unsignalized Rural IntersectionsIDS Quarterly MeetingJune 14-5, 2004
Addressing Rural Intersection Safety Issues: • The primary problem at rural intersections involves a driver on the minor road selecting an unsafegap in the major road traffic stream. • Consider study of 1604 rural intersections (2-lane roadways, Thru/STOP intersection control only, no medians) over 2+ year period.
Addressing Rural Intersection Safety Issues • Analyzed 768 right angle crashes on 409 different intersections. • Nearly 60% occur after vehicle on the minor roadway stops • Approximately 25% involved vehicle running through the STOP sign. Source: Howard Preston CH2MHill … i.e. problem is one of gap selection, NOT intersection recognition
Recognized National Problem • NCHRP Report 500: Vol. 5 Unsignalized Intersections • Identifies objectives and strategies for dealing with unsignalized intersections • Objective 17.1.4 Assist drivers in judging gap sizes at Unsignalized Intersections • High speed, at grade intersections Guidelines for Implementation ofAASHTO Strategic Highway Safety Plan
Minnesota Focus • Rural unsignalized intersections: • High-speed corridors • Through stop intersections • Traffic surveillance technologies(& on-site validation) • Gap detection/estimation (& on-site validation) • Human interface design(& simulator evaluation) • Goal - Results from above to lead to next phase: • Approval of DII by MUTCD National Committee for DII • National Field Operational Test:
IDS Program • Tasks • A. Crash Analysis • B. Enabling Research • Surveillance systems: Test and eval at isxn • Experimental Intersection Design, Construction, and Implementation • Human Factors: Eval in driving simulator • C. Benefit:Cost Analysis • D. System Design
3,784 Thru-STOP Isxns in MN Hwy Systemwere evaluated • Total> CR (% of total) • 2-Lane - 3,388 | 104 (~ 3%) • Expressway - 396 | 23 (~ 6%) Task A: Crash Analysis • Analysis of present conditions and intersections • Identification of Experimental Site: Minnesota Crash Data Analysis
Task B: Enabling Research • Surveillance Technologies • Sensors – • Determine location and speed of high speed road vehicles • Determine type of vehicle on low speed road (signal timing) • Sensor placement, intersection design, etc. • Communications • Transmit data from sensors to IDS main processor (RSU) • Wired / Wireless options • Computational systems • Determine location, speed, and size of vehicle gaps • Performance issues: • Redundancy, reliability, range, power, cost, estimation vs. sensor coverage, etc.
Enabling Research:Driver Infrastructure Interface (DII) Development • Human Factors … Nic Ward • System interface development • Simulation development • System interface evaluation
TASK C: Benefit:Cost AnalysisDavid Levinson • Identify relevant technologies: Review of literature. • Develop benefit cost framework. • Estimate lifespan of technology. • Estimate costs of technology. • Estimate benefits of countermeasures. • Lifecycle analysis. • Recommend countermeasures • Analyze Inter-technology effects. • Determine performance metrics. • Develop cost:performance models • Analyze synergies. • Optimize counter-measure combination
Task D: System Requirements & Specification Definition • Functional Requirements • System Requirements • System Specifications • Experimental MUTCD Approval • Driver interface likely to fall outside the normal devices found within the MUTCD. Will work to gain MUTCD approval as soon as candidate interface is determined
Surveillance Technologies:Outline • Vehicle detection sensor development • Radar sensor development and testing • Lidar sensor development and testing • Vision-based sensor development and testing • Vehicle classification sensor development • Vehicle tracking estimator • Test intersection sensor configuration to validate installation • Experiments to be conducted at test intersection
Vehicle-detection Sensor Development • Eaton Vorad EVT300 radar to be used for high speed vehicle detection – have determined accuracy as a roadside sensor • SICK LMS221 lidar to be used for vehicle detection at low speed (on minor leg) – accuracy of vehicle detection algorithm to be determined • Vision-based vehicle detection algorithms being developed for low speed vehicle tracking (on minor leg and the intersection) and performance measurement of radar on major leg
Experiments to determine radar accuracy • Eaton Vorad radar is designed for use on vehicles, typically mounted on bumper • Determine radar’s performance while used as roadside sensor • Use probe vehicles with DGPS and compared vehicle position to radar detected position • Drove probe vehicles past radar • Varied radar orientation (yaw angle) • Varied distance from road (two different lanes) • Varied vehicle type (Mn/DOT truck and sedan) • Experiments performed at Mn/Road in October 2003
Experiment Objectives For each independent variable, determined : • Lane coverage • Lane classification accuracy of the sensor • Lane position accuracy of the sensor • Speed measurement accuracy of the sensor
Variable Definitions:Theoretical Lane Coverage– Measure of vehicle detection start and stop Lane Centers Theoretical Lane Coverage:Different for each lane
Variable Definitions:Lane Classification and Lane Position Accuracy • Lane Classification: In which lane is the vehicle? (Accuracy limited by lateral position error) • Lane Position Accuracy: Limited by longitudinal position error
Variable Definitions:Lane Classification and Lane Position Accuracy • Elat = Lane Lateral Position Error • Elon = Lane Longitudinal Position Error • Know that radar return does NOT come from center of front bumper • Tests will evaluate sensitivity of gap calculation to this effect
Experimental Setup:Orientation Calibration • Initial calibration to get the reference yaw angle with respect to North
Experimental Setup:Signal Flow Diagram Target Data: Position (StatePlane Coord),Velocity Vehicle Data: Position (State PlaneCoord), Velocity,Heading
Results – Typical run with truck • Typical run: Truck at 45 mph • Error Curve for the entire run • RMS Values are used in evaluation • 10 m. max longitudinal error leads to 0.5 sec gap error at 45 mph (20m/sec)
Results – Actual vs Theoretical Lane Coverage for Varying Sensor Orientation • Both cases:Actual Lane Coverage Theoretical(Predicted) Lane Coverage • Can use theoretical parameters to design sensor layout • 6 degrees gives best coverage for both lanes A Inside T A Outside T Inside Lane – 14ft from Lane CenterOutside Lane – 26ft from Lane Center
Results– Lane Lateral Position Accuracy • Lane lateral position error lower when sensor closer to lane • Lane lateral positionerror increases with increase in sensor orientation angle • Error within 1.2m for most runs (when under6 degrees • Lane classification threshold of 1.2m should be sufficient to place a vehicle in one lane (12ft / 3.7m)
Results– Lane Longitudinal Position Accuracy • Error increases with increase in orientation angle • Error lower when closer to lane • Error lower for smaller vehicle • When orientation angle is below 6 degrees, error is below 10m (equivalent to 0.5 sec error in gap; 45 mph)
Results – Speed Accuracy • Accuracy decreases with increase in orientation angle • Error is within 0.35m/s. Equivalent to 0.78 mph; for an 8 sec gap at 45 mph (20m/sec) equiv to 0.14 sec in gap
Experiment Conclusions • Sensor Lane Coverage • Increases when sensor placed closer to lane • Increases with decreased sensor yaw angle • Better than specifications • Lane Lateral Position accuracy of the sensor • Better when sensor closer to lane • Better with lower sensor orientation • Lane Longitudinal Position accuracy of the sensor • Better when sensor closer to lane • Better with lower sensor orientation • Better for smaller vehicle • Speed measurement accuracy of the sensor • Better with lower sensor orientation • Error within 0.35 m/s (0.78 mph)
Lidar detectorsLIDAR - LIght Detection And Ranging • SICK LMS221 sensors are used – works at 5Hz; low speed minor leg application • Developed roadside vehicle detection/classification algorithm • Experiments similar to those for radar to be performed in July 2004
Development of vision-based detectors • Both visible-range and IR cameras will be tested • Vehicle detection algorithm developed to detect vehicles moving along a lane as well as making turns • Experiments to be conducted in July 2004 to determine the performance of both types of cameras under different lighting conditions
Development of vision-based detectors • Data collected at the Washington Ave parking ramp exit to Union. • Thresholds set to ignore pedestrians and bicyclists • Algorithm sufficient to determine lane position and trajectory of vehicle
Vehicle-classification sensor testing • Eaton Vorad radar based system to be tested when installed at the Hwy52 test intersection • SICK LMS221 lidar based system to be developed – will be tested at test intersection • Both sensors will be used to cover the same area; the accuracy of the two sensors will be determined by comparing images captured of the vehicles with the radar data (for multiple vehicles)
Vehicle Tracking Estimator • Estimator will be capable of tracking every vehicle in the system and predicting time to a pre-determined point at the intersection • Two types of tests to be conducted to determine accuracy • Low-volume traffic using DGPS-based probe vehicles • High-volume traffic using a vision-based vehicle detection system
Tracking Estimator Validation System • Camera placed perpendicular to traffic direction • Accuracy of test system to be validated by processing video and comparing results with the radar’s reported results • Estimator error, false targets and missed targets will be determined
Test Intersection Sensor Configuration:Major Leg – Hwy52 • Radar sensorson Hwy52 • Approximately 2100ft of lane coverage in each direction (17.2 secs at 85mph) • Average sensor spec’d orientation angle is 4.9º
MN Test Intersection- Mainline Sensors Camera Suite (for evaluation) Radar to track vehicles past isxn (primarily for minor road trajectory recording) Radar Camera FOV 53’x36’
C4 FOV C3 FOV Intersection Crossroads- Vehicle Trajectory Cameras at intersection capture trajectory of vehicles entering isxn from minor roads. Mn/DOT advised that median-based sensors won’t survive.
Test Intersection Sensor Configuration:Minor Leg – CSAH 9 • Radar and lidar sensors on CSAH9 • Radar to detect approaching traffic and lidar used for slow/stopped traffic • Vehicle classification radar and lidar also used
Test Intersection Sensor Configuration • Vision-based sensors for the median • Both IR and visible-range cameras will be tested
R/WIS Data from Intersection Mn/DOT updates at 10 Minute intervals. Data collected every 10 minutes
Experiments to be Conducted at Test Intersection • Determine effect of vehicle length, speed, lateral location on radar-based position and gap calculations • Determine accuracy of lidar-based and vision-based vehicle detection/tracking systems • Vehicle entering intersection from minor leg • Validation of vehicle classifier systems • Radar vs lidar • Determine accuracy and robustness of Gap Tracking Estimator
Information Available from Intersection • Distribution of gaps accepted by drivers • for right turns • for left turns • for crossing intersection (see next page) Cross-correlated with • Vehicle type / size • Driver age (macroscopic level, limited basis initially) • Driver gender (limited basis initially) • Weather effects (R/WIS 0.9 Mile away), with in-road sensors (collecting data already)
Information Available from Intersection (cont’d) • Maneuvers executed by drivers from minor road • Left turn in one stage or two? • Variation in left and right gaps accepted for each maneuver type • Cross-correlation with vehicle type • Crossing intersection in one stage or two? • Variation in left and right gaps accepted for each maneuver type • Cross-correlation with vehicle type