Download
1 / 13
140 likes | 282 Views
In Vivo Optical Coherent Tomography (OCT) and its Application for Brain Research. Vassiliy Tsytsarev University of Maryland school of Medicine E-mail: tsytsarev@umaryland.edu. Dependence of Tissue Penetration from Wavelengths. Thickness of tissue probed: 30 m m 100 m m 1mm 1cm 10cm.

E N D
In Vivo Optical Coherent Tomography (OCT) and its Application for Brain Research Vassiliy Tsytsarev University of Maryland school of Medicine E-mail: tsytsarev@umaryland.edu
Dependence of Tissue Penetration from Wavelengths Thickness of tissue probed: 30 mm 100mm 1mm 1cm 10cm l 400 nm 800 nm 1600 nm 10 mm 100 mm 2-Photon Microscopy Diffuse Optical Tomography Optical Coherence Tomography Intrinsic Optical Imaging (IOS) Photoacoustic THz imaging ???
Depth Penetration / Spatial Resolution 2-Photon Microscopy Depth Penetration (μm) Functional Magnetic Resonance Imaging (fMRI) 10000 Optical Coherence Tomography (OCT) 1000 100 Intrinsic and Voltage-Sensitive Dye Optical Imaging (IOS) 100 10 0.1 1.0 10 100 1000 Resolution (μm)
Optical Coherent Tomography Computer Broadband light source 2x2 Coupler Lateral scanning Signal processing 2x1 Coupler Moving mirror Basic principle: Back-reflected from the tissue light and the light produced by reference arm recombine within the 2 × 2 coupler
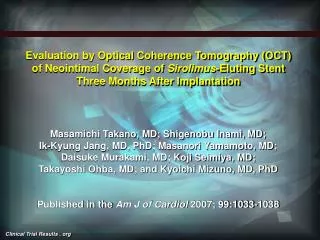
OCT: experimental setup Schematic of optical coherence tomography (OCT) and video microscopy system. DCG, dispersion-compensating glass; TIA, transimpedance amplifier; BPF, bandpass filter. Also shown is the forepaw stimulation protocol. Aguirre et al, Opt. Lett., 2006
OCT cortical functional brain imaging: experimental paradigm Precise registration of OCT imaging to the region of functional activation. The OCT scan is directed in the region of interest measured with video microscopy (A, B). Horizontal bars in B mark the activated and baseline time windows used to generate the functional map in A. Structural OCT imaging (C) visualizes the skull (S), surface vasculature (V), and meningeal layers, including the dura mater (D).
Functional OCT in the rat cortex. A fractional change map (A) demonstrates positive (warm colors) and negative (cool colors) changes in OCT signals during stimulation. Temporal sequences (B) reveal the presence of highly localized regions of activation in the cortex that persist throughout stimulation. The horizontal bars in D indicate the time windows used to generate the functional map (A, B, C).
Somatosensory cortex OCT functional imaging: forepaw stimulation Precise co-registration of OCT imaging to the region of functional activation. (A) The OCT scan is directed across the region of interest (indicated by blue double-headarrow) as measured with OISI. Anatomical features such as blood vessels (V) can be visualized in OISI and can be used to co-register with OCT image. (B) Structural OCT image reveals high-resolution visualization of the skull (S), surface vasculature (V), and meningeal layers, including the dura mater (D) and arachnoids (A). Cortex region (C) can also be visualized. (C) Three-dimensional rendering of the volume acquired by OCT. (D) En face OCT image reveals the characteristic blood vessel network which can be used to register the OCT imaging volume with OISI Y. Chen et al. / Journal of Neuroscience Methods 178 (2009)
OCT vs IOS: what is the signal base? Spatial (right) and temporal OCT and IOS response structure
Forepaw OCT: temporal dynmics Spatial-temporal evolution of functional OCT signals in the rat cortex. A fractional change map demonstrates the presence of positive (warm colors) and negative (cool colors) changes in OCT signals during stimulation. Functional OCT images at each individual temporal point (t = 1–15 s) reveal the presence of highly localized regions of activation in the cortex that persist throughout stimulation. Bar: 500 mkm. Chen et al, 2009
Forepaw OCT imaging: crosectional vs frontal Integrated OCT signal in response to the forepaw electrical stimulation (Chen et al, 2006)
Optical Coherent Tomography of the Epileptic Seizures EEG 10 s / 2 mV