Download
1 / 30
310 likes | 562 Views
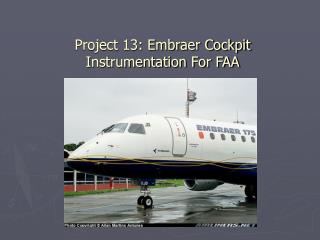
Project 13: Embraer Cockpit Instrumentation For FAA. Team Members. Project Summary. The client is developing the flight dynamics for the Embraer 170/175 aircraft using the open source Flight Gear simulator.

E N D
Project Summary • The client is developing the flight dynamics for the Embraer 170/175 aircraft using the open source Flight Gear simulator. • They need graphics software to simulate the functionality of the actual cockpit by simulating the gauges in the primary flight display (PFD), navigation display (NavDisplay), engine instruments (EICAS) display. Sample Embraer PFD
Architecture – Logical • When our software executes, a user settings file will be loaded into the system. The file contains font path, Flight Gear NAV Data path, and display settings. • Our software will use the setting to initialize the graphics engine (window size and NAV database) and launch the graphics loop. • The three displays will be rendered. All displays are rendered based on the user settings and NAV Data. The NAV Data is updated every 1/24 of a second.
Architecture - Process • Our project involves two major processes: Main Embraer Display process and Flight Gear Simulator process. • The Main Embraer Display Process includes tasks such as rendering and parsing user setting and NAV data. • The Flight Gear Simulator Process is used for user input (E.g. takeoff, landing, 360 degree spin, etc) so that the NAV data can be updated.
Architecture - Development • From the development standpoint, our project consists of three major layers. • Layer 1 handles object initializations, parsing user setting file and retrieve NAV Data. • Layer 2 prepares graphics settings and render window. • Layer 3 renders the three displays.
Architecture - Physical • Our system can be run on two nodes. • One node will be used for our Embraer Instrumentation Process. • The Flight Gear Simulator Process will be run on a separate node since it’s an graphically intensive OpenGL application.
Architecture – Sample Use Case Scenario • John configured our application to run on 1024 x 768 and set the Flight Gear NAV Data path. • John started up our application and saw the three displays rendered. However, the NAV data stayed the same. • John starts up Flight Gear Flight Simulator. He took off, set speed at 350 MPH, and turn left 90 degrees. • The application receives the updated NAV data and render the displays to reflect the updated speed and heading. Actual Embraer Cockpit
Reuse of Critical Components • In order of importance • PFD (Critical Component) • Reusing examples from the OpenGC artificial horizon example • Reusing part of the OpenGC Nav. display as our “compass” sub section in our PFD • Nav. Display • Unfortunately will have to be done almost from scratch. • Engine Display • Parts of the engine display can be reused from existing OpenGC engine display, but are cosmetically different.
Performance • Compiled under Visual Studio .NET 2003 • PFD display took 0.3 seconds to render on an Intel Pentium 4 processor 2.8 MHZ with 512 MB of ram. • Reused 60% of gauge components within the original OpenGC project. • Stable releases of external library components are in use.
Design for Simplicity • Fonts manager, RenderWindow, AppObject, and parts of gauge components from OpenGC are reused or slightly modified. • Gauges use communicational cohesion, which operate from the same data source. • Gauges also use data coupling, which is only simple data being passed between modules
Design for Maintainability • Well-documented code • External libraries are upgradeable within he project environment • Low coupling between the PFD, NAV display, and Engine display gauges • Informative error messages showing which method fails.
Design for Testability • Our system has convenient interfaces to drive the execution and verification tests. • Our system has been decomposed into components for processing of successive refinements. • We’ve considered a high-level conceptual model in terms components and their interaction for developing a number of scenarios of anticipated changes and assessing the degree to which the architecture supports these changes, quality aspects like maintainability and flexibility may be tested at any early stage.
Design for Reliability • Ideally we need to design to operate failure free. To do so we need to make sure: • We have accurate data input. • Transform the data properly. By examining the expected usage pattern of our system, we can identify which areas of concentration are needed for debugging. We expect the mean time between failures to be less than 100 hours.
Estimated SLOC Models Using the COCOMO II method developed at University of Southern California: Center for Computer Software Engineering • Top Down Approach • Function Point • Internet Point • Feature Point • Capability Requirement
Labor Rates Used • Test/QA: $18.00 • Copywriter: $15.09 • Art/Media: $17.63 • Management: $24.00 From the Educational Development Department of California Avr. Salary Per Hour (Aprox. for Test/QA and Management) • Strategist: $23.97 • Analyst: $17.05 • Designer: $14.38 • Programmer: $18.82
Function Points • Calculation: • # input types > 1 • # output types > 2 • # inquiry types > 1 • # logical internal files > 1 • # interfaces > 2 • UFP = 4I + 5O + 4E + 10L + 7F • = 42 (Originally 49) • DI = I + O + E + L + F • = 7 • TCF = 0.65 + 0.01DI • = 0.72 • FP = UFP x TCF • = 30.2 Function Points (Originally 35)
COCOMO (1/2) • Effort in staff months = b * KDLOCc • b = 2.4 and c = 1.05; these are constants determined by project size, innovation, deadline, and constraints • KDLOC: thousands of lines of delivered source code (not including comments or unmodified third party code)
COCOMO (2/2) = 6 and 1/4 student months (based on re-evaluated approximation of 2500 lines)
ICED-T • Intuitive: The Embraer designers dealt with the intuitiveness of the cockpit itself, but the virtual implementation must be able to match the intuitiveness of the actual thing. • Consistent: It is highly important that the virtual cockpit be consistent with the actual Embraer ERJ cockpit. However, the team was unable to obtain a manual for the Honeywell Epic Display system. As a result, the project will be based on the Regional Jet Display demos at Project Magenta’s website and various pictures found on the internet. • Efficient: Flow of information must be constant. Changing modes in displays must take < one second. • Durable: Inherently compromised since part of the total package employs alpha and beta version software. • Thoughtful: Project is an implementation of an existing design, rather than an entirely new cockpit created from scratch.
Current Schedule Milestones: 0.1 - PFD 0.2 - NAV 1.0 - EICAS