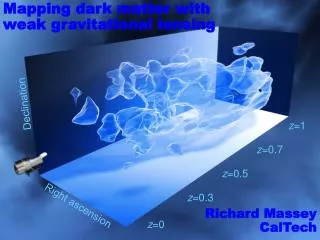
3D dark matter map
3D dark matter map. Mapping dark matter with weak gravitational lensing. Declination. z =1. z =0.7. z =0.5. z =0.3. Right ascension. Richard Massey CalTech. z =0. Gravitational Lensing. Observe light from distant galaxies, behind any structure we’re interested in. Translation

3D dark matter map
E N D
Presentation Transcript
3D dark matter map Mapping dark matter with weak gravitational lensing Declination z=1 z=0.7 z=0.5 z=0.3 Right ascension Richard Massey CalTech z=0
Gravitational Lensing Observe light from distant galaxies, behind any structure we’re interested in. • Translation • Magnification • Shear • Flexion/curvature zgalaxy≈1 zlens≈0.3–0.5 zobserver=0 Gravitational lenses are sensitive to any mass along the line of sight and, like glass lenses, are most effective when it is half way between the source and the observer.
CL 0024+17 NASA, ESA, and M. J. Jee (JHU)
Weak Gravitational Lensing Observe light from distant galaxies, behind any structure we’re interested in. • Translation • Magnification • Shear • Flexion/curvature zgalaxy≈1 zlens≈0.3–0.5 zobserver=0 Shapes of galaxies are random so, in the absence of lensing, averaging ~100 would produce a circle. Galaxies on adjacent lines of sight are coherently distorted. Gravitational lenses are sensitive to any mass along the line of sight and, like glass lenses, are most effective when it is half way between the source and the observer.
Hubble Space Telescope COSMOS survey Gravitational lensing convergence projected mass • Largest ever survey with HST • 1.6 square degrees in IF814W band • Depth IF814W<26.6 (at 5) • 2 million galaxies, zmedian=1.2 • Small, diffraction-limited PSF • ~80 resolved galaxies/arcmin2 • Follow-up from radio to x-rays • Photo-zs from 17 optical/IR bands Dark matter simulation at z=0.5 Andrey Kravtsov and Anatoly Klypin (National Center for Supercomputer Applications)
B-mode check for residual systematics R. Massey et al. (Nature 2007)
Redshift tomography z=0.7 z=0.5 z=0.3 years ago
Statistical analysis of 3D mass distribution R. Massey et al. (ApJ 2007), J. Lesgourgues et al. (JCAP submitted) Cosmological parameter constraints Shear-shear correlation function z=0.7 z=0.5 VHS Ly forest SDSS Ly forest z=0.3 WMAP COSMOS 3D weak lensing
Redshift-distance relation James Taylor et al. (in prep) Cumulative shear signal Well-know shape as a function of angular diameter distance from simple lens geometry Redshift Cumulative shear signal Cumulative shear signal Redshift Redshift
Comparison with baryons Weak lensing mass contours (HST) Extended x-ray emission (XMM-Newton) Galaxy number density (Subaru/CFHT) Galaxy stellar mass (Subaru/CFHT) R. Massey et al. (Nature 2007)
Mass vs light tomography (z~0.3) R. Massey et al. (Nature 2007) ~19Mpc 19Mpc
Mass vs light tomography (z~0.5) R. Massey et al. (Nature 2007) ~26Mpc 26Mpc
Mass vs light tomography (z~0.7) R. Massey et al. (Nature 2007) ~31Mpc 31Mpc
“Bullet” cluster 1E0657-56 Doug Clowe, Marusa Bradac et al. (Astrophysical Journal 2006) 1.5’
“Bullet” cluster 1E0657-56 Doug Clowe, Marusa Bradac et al. (Astrophysical Journal 2006) 1.5’
Face-on bullet James Jee et al. (Astrophysical Journal 2007)) Radial mass profile Two clusters along line of sight
Face-on bullet NASA, ESA and M. J. Jee (Johns Hopkins University)
Conclusions & future prospects Remarkably fast progress since first statistical detections of cosmic shear in 2000. Gravitational lensing is now a major tool in cosmology. We can now compare the large-scale distribution of baryons to that of mass. In general, baryonic structures are built inside a dark matter scaffold. Discrepancies on small scales reveal the different (e.g. non-interacting) properties of dark matter. Statistical analyses of the mass distribution constrain cosmological parameters, trace the growth of structure, and measure the expansion history of the universe. Could not have been done from the ground. Wide-field imaging from space is essential, backed up by multicolour photometry: the untimely failure of ACS is heartbreaking. Hubble provides a unique proof of concept for ambitious, dedicated missions in the future.
Lensing sensitivity with redshift Resolved background galaxies Foreground lensing sensitivity Redshift
Ground vs space (mass maps) R. Massey et al. (Nature 2007), M. Kasliwal et al. (Proc. AAS 2007) SPACE GROUND Using 71 galaxies per arcmin2
Ground vs space (B-mode/noise in mass maps) R. Massey et al. (Nature 2007), M. Kasliwal et al. (Proc. AAS 2007) SPACE GROUND Using 71 galaxies per arcmin2
Ground vs space (cluster detection over z range) M. Kasliwal et al. (Proc. AAS 2007) Redshift 0.73 Redshift 0.93 GROUND GROUND SPACE SPACE Redshift 0.35 Redshift 0.22 SPACE GROUND SPACE GROUND
Mass vs x-rays A. Finoguenov (in prep)
Charge Transfer (in)Efficiency STIS image, Paul Bristow Trailing during CCD readout creates a spurious, coherent ellipticity. Affects photometry, astrometry and morphology of faint galaxies.
PSF variation J. Rhodes (ApJ 2007) J. Jee (ApJ 2005) HST “breathing” affects both size & ellipticity of PSF • Effective focus changes by • 3m per orbit • 12m in ~days
PSF variation J. Rhodes (ApJ 2007)
Shear TEsting Programme (STEP) simulations R. Massey et al. (MNRAS 2004) Real image Simulated image Manufacture realistic images, containing a known shear signal. Animations show 0-10% shear in 1% steps (real signal is ~2%).
Shear TEsting Programme (STEP) results C. Heymans et al. (MNRAS 2006) R. Massey et al. (MNRAS 2007)
Mass vs light 2D projection R. Massey (Nature 2007) 20’
Growth of dark matter structure R. Massey et al. (ApJ 2007) Fraction of mass on various scales
Lensing is coming of age PSCz galaxy density < 150 Mpc/h W. Sutherland et al. (1991) COSMOS mass density, R. Massey et al. (Nature 2007)