Download
1 / 48
480 likes | 654 Views
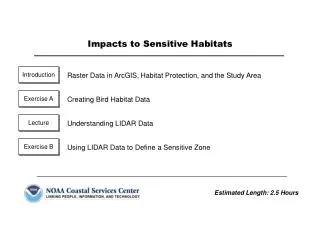
Introduction. Raster Data in ArcGIS, Habitat Protection, and the Study Area. Exercise A. Creating Bird Habitat Data. Lecture. Understanding LIDAR Data. Exercise B. Using LIDAR Data to Define a Sensitive Zone. Impacts to Sensitive Habitats. Estimated Length: 2.5 Hours.

E N D
Introduction Raster Data in ArcGIS,Habitat Protection, andtheStudy Area Exercise A Creating Bird Habitat Data Lecture Understanding LIDAR Data Exercise B Using LIDAR Data to Define a Sensitive Zone Impacts to Sensitive Habitats Estimated Length: 2.5 Hours
In this module you will learn about the coastal setting in the context of habitat conservation of sensitive habitats. The coast of South Carolina is home to numerous species of birds. Under increasing pressure from human interaction, these animals are becoming extremely vulnerable. In order to protect the habitat of the different bird species, it is important to first understand the habitat constraints. It is then important to put into practice specific strategies aimed at protecting the habitats. You will begin by examining the spatial nesting requirements of the Eastern Brown Pelican and then the Royal Tern. Then, you will focus on the identification and protection of its nesting habitat through a series of spatial analyses. Creating new shapefiles and editing the attribute tables Digitizing feature locations using ancillary data sets as reference maps Acquisition and importing of Light Detection and Ranging (LIDAR) data for project use Creating LIDAR contours from raw point data Constructing buffers for sensitive area designation Impacts To Sensitive Habitats Module Introduction Overview • ArcGIS Components • ArcMap • ArcCatalog • ArcToolbox • ArcGIS Extensions • Chart Viewer • Spatial Analyst • Geoprocessing Tools • Buffer Wizard • Select-By-Attributes • Select-By-Location Tools and Technology Skills Learned
Impacts To Sensitive Habitats Introduction: Raster Data in ArcGIS • Working with Raster Data • Raster data can be viewed in ArcMap; many different file types are supported • The Spatial Analyst extension is needed to work with raster data • Derive information • Identify spatial relationships • Find suitable locations • ArcToolbox contains tools to convert various data formats to raster
Impacts To Sensitive Habitats Introduction: Habitat Protection • GIS and Habitat Protection • GIS can be used in habitat protection to • Identify the location of a habitat • Delineate a protected or sensitive zone surrounding a known habitat • Determine proximity of habitat to adverse environmental factors • Data sets that are useful for a GIS analysis involving habitat protection in the coastal setting include • Bathymetry data • Elevation data • Landuse/Landcover data • Hydrology • In most cases, field data collection is needed to accurately identify a habitat location
Impacts To Sensitive Habitats Introduction: Study Area • Deveaux Bank Heritage Preserve • Lies at the mouth of the North Edisto River in Charleston County • Part of a dynamic barrier island system • Composed of marine grassland community • Established to protect significant nesting habitat of seabirds and shorebirds • Supports colonies of nesting water birds • Accessible only by boat, but closed to the public during breeding season (April 1 to October 15)
Background You are a wildlife biologist for the Department of Natural Resources and are involved in a study on bird populations and nesting densities on Deveaux Bank, South Carolina. Your study objective is to determine the total amount of spatial area needed for two species of shorebirds, the Eastern Brown Pelican and the royal tern. You have aerial photographs of the protected bird nesting habitat. You need to determine spatial information without disturbing the birds during the incubation period. From the aerial photographs, you can determine the minimum inter-nesting distance and the nesting density of the two species of shorebirds. The distance between nesting birds and their nearest neighbors can be turned into a digital layer from the photo, and conclusions can be drawn from the spatial measurements using the digital information derived from the aerial photograph. Objectives Create a new layer and digitize points from an aerial photograph Add attributes to the layer’s associated table Create buffers around the points to create a spatial layer showing the approximate minimum spatial nesting requirement Calculate the total area utilized for nesting habitat in the study area Impacts To Sensitive Habitats Exercise A: Creating Bird Habitat Data Goal After hearing the lecture and working through the exercises, the student will be able to apply spatial data creation and geoprocessing tools to identify this sensitive habitat and address potential human impacts.
Impacts To Sensitive Habitats • “Tools” Toolbar • Measure Tool – Allows you to measure the distance along a line between two or more points on the map • Pan Tool – Allows you to pan around the map document • “Editor” Toolbar • Create New Feature Tool – Adds features to the edit sketch • Edit Tool – Edits features and their geometries • Zoom In Tool – Zooms in by clicking a point or drawing a box Tools to Use Exercise A: Creating Bird Habitat Data • Summary of Process Steps • Create a new shapefile –Use ArcCatalog to create a new point feature shapefile to be edited in ArcMap • Add fields to attribute table – Add fields for species name, incubating status, and proximity • Digitize the pelicans and nests –Create edit session; use deveaux_photo as a base layer and the study_area layer as spatial bounds • Edit the attribute table –Record species, as well as incubating status for each digitized nesting location • Digitize the incubating royal terns –Use same base layer and spatial bounds;after digitizing, edit attribute table • Calculate the proximity field –Record average minimum spatial requirement between species and their neighbors (pelicans: 0.31 meters, terns: 0.08 meters) • Give each nest type a unique value –Change symbology of layer you digitized to show unique values • Create buffers –Use values from proximity field to create buffers surrounding nesting locations • Calculate the total spatial nesting area –Create a new “Area” field and use Field Calculator to enter an expression that calculates spatial nesting area Data In the Sens_Hab data directory: Deveaux Bank.mxd ArcMap document deveaux_photo.tif Image file study_area.shp Polyline shapefile Rockville_NE.sid Image file Rockville_SE.sid Image file Rockville_SW.sid Image file Rockville_NW.sid Image file pelican.tif Image file royaltern.tif Image file
Impacts To Sensitive Habitats • Shapefile – A vector data storage format for storing the location, shape, and attributes of geographic features Glossary Terms Exercise A: Creating Bird Habitat Data • 1. Create a newshapefile • To begin, start ArcCatalog. Navigate to the Sens_Hab data directory • Click on File > New > Shapefile: the Create New Shapefile dialog box will appear. Enter nesting_data as the name for the new shapefile. The shapefile you are creating will be composed of point features; therefore, make sure Point is selected in the Feature Type box. In order to define the projection of the shapefile, click Edit and then Select; define the coordinate system as Projected – UTM Zone 17N using the NAD 1983 datum. Click Add and OK to complete this task. • An examination of the Module 1.3 data directory will show that a new shapefile, nesting_data.shp, has been created. While ArcCatalog allows you to create and change the structure and properties of a shapefile, you must use ArcMap to modify its features and attributes. • Start ArcMap by clicking on the Launch ArcMap button in the ArcCatalog toolbar. When prompted, start the program with an existing map, navigate to the sens_hab data directory and select the Deveaux Bank.mxd ArcMap document file. • Close ArcCatalog • This map document contains all the data that you will need to digitize bird nesting positions. Before moving on to the next step in the process, take a closer look at the data.
Impacts To Sensitive Habitats • DOQQ – Digital Orthophoto Quarter-Quadrangles: high-resolution digital aerial photographs that are georeferenced to their position on the Earth’s surface • For more information on Deveaux Bank visit SC DNR’s Heritage Trust Preserve site: • http://www.dnr.state. • sc.us/wild/heritage/hp/deveauxbnk/default. • htm Glossary Terms Exercise A: Creating Bird Habitat Data 1. Create a new shapefile (continued) • There are four data layers that are displayed when the map document is opened. These are the four United States Geological Survey (USGS) DOQQs for the Rockville quadrangle. The files are in the MrSID (.sid) compressed image format that is supported within ArcView 8. • Deveaux Bank is the 15-acre horseshoe-shaped small sand island pictured in the Rockville SE DOQQ. The North Edisto River empties into the Atlantic Ocean and separates Seabrook Island to the right and Botany Bay Island to the left. • Turn on the Deveaux Photo aerial photograph layer. You should see a miniscule dot located on the east side of the bank. This photo was taken with a camera attached to a kite approximately 100 feet in the air. • Take a closer look at the photograph. Turn off all four of the DOQQs. Right-click on the Deveaux Photo layer and click Zoom to Layer. • Closely examine the vegetation in the photograph. You should notice that the right portion of the photo is predominately sand, and the region on the left consists of grasses and shrubs. Look closely at the sand. Do you notice a polka dot appearance? These are nesting royal terns. They have a small inter-nesting distance in order to reduce predation on the colonial nesting species, which increases nesting success. Web Sites
Impacts To Sensitive Habitats • Heads-up digitizing – the act of drawing points, lines, or polygons on a computer screen using a reference, background, or layer, such as an aerial photograph Glossary Terms Exercise A: Creating Bird Habitat Data 1. Create a new shapefile (continued) • Where do the Royal Terns seem to nest? _____________________________________ • ______________________________________________________________________ • To get an up-close example of the bird, turn on and zoom to the Royal Tern layer. • Turn off the Royal Tern layer and zoom to the Deveaux Photo layer. • Look closely at the vegetated area in the upper-left corner of the photo. Do you see a larger polka dot pattern? The larger dots are pelicans incubating eggs in their nests. • Where do pelicans seem to nest? How does this differ from Royal Terns? • _______________________________________________________________________ • _______________________________________________________________________ • _______________________________________________________________________ • Turn on and zoom to the Eastern Brown Pelican layer to get a closer view of the birds and their nesting habitat. After viewing the image, zoom to the Deveaux Photo layer once again. • Turn on and zoom to the Study Area layer. • You will now create a digital layer of all the bird nests in this study area using a process known as heads-up digitizing.
Impacts To Sensitive Habitats • In ArcView 8, you must add fields to an attribute table before you start editing the attribute information in an edit session • Precision – The number of digits that can be stored in a field • Scale – The number of decimal places for float and double field types Did You Know? Exercise A: Creating Bird Habitat Data 2. Add Fields to Attribute Table • Click on the Add Data button , navigate to the Sens_Hab data directory, and select the nesting_data.shp shapefile that you created earlier. • Right-click on the nesting_data layer in the table of contents and select Open Attribute Table. • An examination of the attribute table for the shapefile you just created shows that each record has three fields that are used by ArcView to identify each record. For this exercise, you will want to add attribute information to each of the digitized features you create. Three fields will be added to the attribute table that will contain this information. • With the attribute table open, click on the Options button and select Add Field. In the Add Field dialog box, enter Species as the field name, and select Text as the Field Type. Enter 15 as the Length and Click OK. • Repeat the same process twice to add two more fields to the table. Name the second field Incubating and select Short Integer as the Field Type. Name the third field Proximity, set the Field Type as Float, the Precision to 3, and Scale to 3 in the Properties box. • Close the attribute table when you have finished adding the necessary fields. Glossary Terms
Impacts To Sensitive Habitats • Instead of using the Add Data button, you can drag and drop data layers from ArcCatalog directly into ArcMap Did You Know? Exercise A: Creating Bird Habitat Data • 3. Digitize the Pelicans and Nests • Select the nesting_data layer in the table of contents. • Click on the Editor drop down menu found on the Edit tool bar and select Start Editing to start an edit session. • Select Create New Feature in the Task drop-down menu. • Make sure the Target Layer drop-down menu has nesting_data selected. • Click on the Sketch tool and move your cursor over one of the pelicans in the image. Click your left mouse button to create the point. When digitizing each point, be consistent in the placement of the point because you will be measuring distances between points at a later time. Use the Zoom In and Pan tools to more accurately digitize the points. • Continue to digitize all the nests that contain pelicans inside the study area; you will digitize empty nests later. • If you make a mistake and need to delete a point, click on the Edit tool , click on the point you wish to delete, and press the Delete key.
Impacts To Sensitive Habitats • Many Global Positioning System (GPS) units allow you to enter attribute data while in the field so you don’t have to edit attribute information at a later time Did You Know? Exercise A: Creating Bird Habitat Data 4. Edit the Attribute Table • Open the attribute table for the nesting_data layer. Clear any selected records by choosing Options > Clear Selection. • You need to add attribute data for each point you just digitized so that you can use the digital layer without depending on the background image. The information needed for this study includes the type of bird on each nest, whether each bird is incubating or away from the nest feeding, and the average minimum spatial nesting requirement for each species. You have already created three fields entitled Species, Incubating, and Proximity that will contain this information. Now you will use the Calculate Values function to populate these fields. • In the attribute table, right-click on the Species field name and select Calculate Values. In the empty text field below [Species]=, type “Brown Pelican” including the quotation marks. Click OK to close the dialog box; all of the records should now contain the appropriate entry. • Repeat the process for the Incubating field. Enter a value of 1, which designates the presence of a bird in its nest (0 designates the absence of a bird from its nest). You do not need quotation marks when entering numeric information in the Calculate Values dialog box.
Impacts To Sensitive Habitats Exercise A: Creating Bird Habitat Data 4. Edit the Attribute Table (continued) • Close the attribute table and digitize the remaining Eastern Brown Pelican nests that are temporarily unoccupied. You can use the Zoom In tool to get a closer view of the vegetated areas. It’s a good idea to save your edits at this point. Click on the Editor button and select Save Edits. • Notice that some of the nests contain eggs while some do not. The empty nests are probably not vacant; the pelicans simply have not laid their eggs yet. According to the time stamp on the photograph, it was taken on May 29 at 15:35. The nesting season in the region is generally between April 1 and October 15. • After you have finished digitizing the unoccupied pelican nests, reopen the layer’s attribute table. To add attribute values to the points you just digitized, you will need to select them from the set of all digitized points. Click on the leftmost column in the table (it will look like a small square and contain no data) to manually select a record. To select multiple rows, hold down the Ctrl key. • Open the Calculate Values function for the Species field. In the text field enter “Brown Pelican” (don’t forget the quotation marks). Since the nests are currently unoccupied, each record should have the number 0 in the Incubating field, the code for Feeding/Bird Absent. ArcView automatically places a zero in the number field, so no changes are necessary.
Impacts To Sensitive Habitats • SQL – Structured Query Language: a language for retrieving information out of relational databases • For more information on SQL visit • www.sql.org • How many points did you digitize? • How does this number compare to other results in the class? Glossary Terms Exercise A: Creating Bird Habitat Data 5. Digitize the Incubating Royal Terns • Now you are ready for the real fun to begin. You need to digitize all the royal tern nests (found in the right-hand portion of the study area). To get a closer view, click on the Zoom In tool and draw a smaller rectangle around an area saturated with nesting royal terns. • Because royal terns nest in the sand, the absence of royal terns from their nests is almost impossible to decipher from the aerial photograph; therefore, assume that the royal terns are incubating their eggs. • Click on the Sketch tool and begin digitizing. Use the Pan tool to move the photograph around in the view. • After you have finished digitizing the royal terns, you need to enter the attribute data into the table. To select all of the royal tern nests you just digitized, click the Options button on the attribute table and select Select By Attributes. This will bring up a dialog box that will allow you to build an SQL expression that will select all of the blank records. Instructions on how to build the SQL expression appear on the next page. Web Sites What Do You Think?
Impacts To Sensitive Habitats Exercise A: Creating Bird Habitat Data Make sure the Method pull-down menu is set to Create New Selection Double-click on the Species field Single-click on the = button Double-click on the ’’ value Click on the Verify button to make sure the SQL expression you created is valid Click Apply and then Close; all of the empty rows should now be selected 5. Digitize the Incubating Royal Terns (continued) 1 1 2 2 3 3 4 5 4 “Species” = ” 6 5 6
Impacts To Sensitive Habitats • The average minimum spatial requirement between nesting Eastern Brown Pelicans and their nearest neighbors is 0.63 meters (2.06 feet). The inter-nesting distance between nesting royal terns is approximately 0.16 meters (6.3 inches) Did You Know? Exercise A: Creating Bird Habitat Data • You need to fill the selected records with “Royal Tern” in the Species field and 1 in the Incubating field. Proceed using the Calculate Values function as described earlier. • Once you have completed entering attribute information, clear all selected features and close the attribute table. 6. Calculate the Proximity Field • Use the Measure tool to measure the distances between nearest neighbors. Click on the tool, then click on one point, move your mouse to the closest neighboring point, and double-click to end the line. Look at the lower-left portion of the screen to find the length in meters for the line segment you drew. Do this for several nearest neighbors. Is the value consistent? • You will create a buffer around each nest that is half the average distance to find the area needed for each bird to nest. Then you will calculate the total area utilized by birds for nesting. First you must enter the size of a buffer into the attribute table. Divide the distance in half for an appropriate buffer size to create an average minimum spatial nesting requirement (see sidebar at right). • Use the Select By Attributes function to create an expression that selects all of the Eastern Brown Pelicans. Using the same process steps as before, create the following SQL expression: “Species” = ‘Brown Pelican’. Click on Verify to make sure the SQL expression you created is valid. Click Apply. All of the records labeled as “Brown Pelican” should be selected in the attribute table.
Impacts To Sensitive Habitats • There are two different ways to clear the selected features of an attribute table. You can either use the Options button in the attribute table itself, or you can use the Selection menu in the user interface Did You Know? Exercise A: Creating Bird Habitat Data 6. Calculate the Proximity Field (continued) • Use the Calculate Values function to set the value of the Proximity field for the selected records to 0.31. • Now click Options > Switch Selection to select all of the Royal Tern records. Use the Calculate Values function to set the value of the Proximity field to 0.08. • Click on Options > Clear Selected to deselect the Royal Tern records. • You have finished entering the attribute information. Stop editing and save your edits by clicking on the Editor menu button and selecting Stop Editing. Click Yes to save your edits. Close the attribute table. • How much time did you spend digitizing and recording attribute information for this small area? _________________________________________________________________ • ______________________________________________________________________ • What implications does this have concerning time and data quality? • ______________________________________________________________________ • ______________________________________________________________________ • ______________________________________________________________________
Impacts To Sensitive Habitats This function is very useful for symbolizing features by their attribute values and could also be used to create a thematic map of your data Did You Know? Exercise A: Creating Bird Habitat Data 7. Give Each Nest Type a Unique Value • Right-click on the nesting_data layer in the table of contents and select Properties. • Click on the Symbology Tab within the Layer Properties window 1 2. Click on Categories > Unique Values 3. Change the Value Field to Species • Uncheck the box next to <all other values> • Click the Add All Values button • Click OK to apply changes 2 1 2 3 3 4 4 5 5 6 6
Impacts To Sensitive Habitats • Buffer –A predefined area surrounding a point or line feature Glossary Terms Exercise A: Creating Bird Habitat Data 8. Create Buffers • Click on Tools > Buffer Wizard. In the first dialog box, choose to buffer the features of a layer and select nesting_data as the layer you want to use. Click Next. • The Buffer Wizard allows you to create a polygon around each nesting location (buffer) using the data that you entered in the proximity field. The sum of the areas of these buffers will provide you with the approximate minimum spatial nesting requirement for both species in the study area. • In the second dialog box, choose to create the buffers based on a distance from an attribute and select proximity as the attribute in the drop-down menu. Make sure the distance units are in meters and click Next. • The third dialog box asks if you would like to dissolve barriers. Click No to keep each nest separate. • At the bottom of the third dialog box, you are asked where you want to save the buffer data. Choose to save the buffers in a new layer. Name the new layer nest_proximity.shp and save the file in your Sens_Hab data directory. Click Finish to begin the buffering process. The new buffer layer, nest_proximity.shp will be added to the TOC.
END OF EXERCISE A Impacts To Sensitive Habitats The NOAA Coastal Services Center would like to thank Jennifer Lamar, graduate of the Masters in Environmental Studies Program at the University of Charleston, South Carolina, for contributing the data, bird photographs, and kite aerial photograph Acknowledgements Exercise A: Creating Bird Habitat Data 9. Calculate the Total Spatial Nesting Area • In order to calculate the area of each buffer, a new field will have to be created in the attribute table of the nest_proximity layer. Open the layer’s attribute table, and select Options > Add Field. Name the field Area, set the field type to Float, and set the Precision and Scale to 3. • Use the Calculate Values function as described earlier to populate the new field with the area of each buffer. Click OK to dismiss the next dialog box. Enter the following SQL expression: ([BufferDist] * [BufferDist]) * 3.14. • In order to find the sum of all of the buffers, right-click again on the Area field and select Statistics. There should be close to a total of approximately 4.56 square meters of occupied nesting territory. This amount will vary depending on the number of points collected, i.e., the value for the count in the Statistics of nest_proximity window. • Close the attribute table and click File > Save to save your changes. • You have completed your study objective of determining the spatial area for nesting birds in the study area on Deveaux Bank. The information you have can be used as a management tool to make decisions regarding the amount of land to set aside when creating a sensitive area. This exercise showed you how to create a theme by digitizing features and adding attributes to the attribute table.
Impacts To Sensitive Habitats Exercise A: Creating Bird Habitat Data • This module introduced you to the Deveaux Bank, which is located within the coastal area of Charleston county. Of particular interest are the environmental conditions that support colonies of nesting water birds. In the habitat management of areas like this, it is important to know the true location of the breeding areas. • In this exercise you began by creating a new shapefile, representing the nesting areas with the use of ancillary data (aerial photography) as reference data. You were then asked to assign attributes to the new data set based on visual analysis (product of imagery resolution) and through the use of specific desktop tools. Exercise Summary Answers to Exercise Questions p. 12 Where do the Royal Terns seem to nest? In the sandy, open areas (white areas) of the study area. Where do pelicans seem to nest? How does this differ from Royal Terns? The pelicans seem to nest in the high-grass areas. The spatial distribution of the pelican nests is less dense than the Royal Terns. The nests of the Royal Terns are mostly located in the open sandy areas, and much closer together. p. 20 How much time did you spend digitizing and recording attribute information for this small area? Individual answers will vary. What implications does this have concerning time and data quality? Individual answers will vary.
Impacts To Sensitive Habitats Discussion: Spatial Data Creation • What other data sources would be useful as a base layer for digitizing data? • Can you think of any other methods for spatial data creation besides heads-up digitizing? • ___________________________________________________________________________________ • ___________________________________________________________________________________ • ___________________________________________________________________________________ • ___________________________________________________________________________________ • ___________________________________________________________________________________ • ___________________________________________________________________________________ • ___________________________________________________________________________________ • ___________________________________________________________________________________ • ___________________________________________________________________________________ • ___________________________________________________________________________________ • ___________________________________________________________________________________
Impacts To Sensitive Habitats Lecture: Understanding LIDAR Data • Introduction • LIght Detection And Ranging • A remote sensing technology used to collect topographic data • Data are collected with an aircraft-mounted laser system • The data used in this module were collected by NASA’s Airborne Topographic Mapper (ATM) • The ATM collects 3,000 to 5,000 spot elevations per second • Researchers have been able to survey beach elevations to a vertical accuracy of ± 20 centimeters
Impacts To Sensitive Habitats Lecture: Understanding LIDAR Data • Applications • Can be used in any application where detailed topographic information is needed: • Floodplain mapping • Erosion monitoring • Hurricane and severe storm impacts • Species habitat suitability • Ideally suited for small study areas • Care must be taken to ensure that the LIDAR data are collected at the appropriate times and processed in the correct manner for the desired use
Impacts To Sensitive Habitats Lecture: Understanding LIDAR Data • LIDAR Data Formatting • Raw Points • Generally more difficult to work with • Are the most accurate data format • Point data files tend to be large and fairly slow to load • Grids • Created by binning the raw elevation data onto a regularly spaced grid • Grid size is an important parameter • Less accurate than raw point data • Easier to work with and visualize • Usually make a more realistic representation of the actual land surface. Raw Point Data Gridded LIDAR Data
Grayscale Hillshading LIDAR Contours Impacts To Sensitive Habitats Lecture: Understanding LIDAR Data • LIDAR Data Formatting • Contours • Most GIS packages can calculate contour lines using grid data • This process usually converts raster data to vector data and can be used as an overlay on other data sets • Hillshade • A technique where the brightness of the scene is first calculated as if it were illuminated by a light source • Creates a grid with highlights and shadows and appears to show the 3-D nature of the data • The hillshade field in the attribute table also can be used as a brightness field for other color schemes to give a color, 3-D look to the data
Impacts To Sensitive Habitats Lecture: Understanding LIDAR Data • Uses: Visualization • LIDAR topographic data can be used to create powerful visualizations of eroded areas following disasters. These images show the pre- and post-storm elevations for a section of Assateague Island, Virginia. The image to the right is credited to the NASA Wallops Flight Facility ATM project. The images shown below were modified from NASA Wallops Flight Facility of the NASA/Goddard Space Flight Center. Washover area Pre-storm – September 15, 1997 Post-storm – February 10, 1998
1998 Vertical Change (m) Impacts To Sensitive Habitats Lecture: Understanding LIDAR Data • Uses: Local Erosion • In addition to visualizing change, LIDAR data also are used to calculate the distance a shoreline has retreated and the volume of sediment that has been lost. These calculations can be applied at a local scale, such as the impact of El Niño on Esplanade Drive, Pacifica, California. April 1998: Post-El Niño Oblique Aerial Photo (Note: cliff position of interest)
Impacts To Sensitive Habitats Lecture: Understanding LIDAR Data • Uses: Statewide Dynamics • LIDAR data also are useful for larger study areas, such as the impact of Hurricane Bonnie along the entire North Carolina coastline. The impact on North Carolina’s coast was examined volumetrically. Most of the areas were severely eroded, although there were also pockets of accretion. Some areas had undergone renourishment since the 1997 survey and showed a gain in sand volume after Hurricane Bonnie. • This analysis was based on two assumptions: 1) all changes seen were due to Hurricane Bonnie, and 2) the 1997 ATM survey was a representative baseline for 1998 pre-Bonnie shore features. These assumptions are probably reasonable in most areas but are not met in the southern North Carolina counties. These areas had undergone significant renourishment during or after the 1997 flights. This management action led the Bonnie impact study to find either no loss or large accumulations of sand in these regions. These were anthropogenic artifacts and not due to Bonnie.
Impacts To Sensitive Habitats Lecture: Understanding LIDAR Data • LIDAR Data Acquisition • TheLIDARDAta Retrieval Tool –www.csc.noaa.gov/ldart/ • The LDART user interface is comprised of three Web pages: • The first page prompts the user to enter an e-mail address and (the first time) name and organization, which are optional fields • The second page allows the user to define boundaries and choose survey dates • The third page provides options for the projection, datum, and file format information
Background Now that you have examined the spatial nesting requirements of the Eastern Brown Pelican, your interests will focus on the identification and protection of its nesting habitat. Listed as an endangered species in 1970, the Eastern Brown Pelican suffered from the widespread use of pesticides such as Dichloro-Diphenyl-Trichloroethane (DDT). The United States ban on DDT in 1973 as well as the Brown Pelican Recovery Plan of 1979 helped spur the recovery of the species to much of its former range. Today, the Eastern Brown Pelican is no longer on the endangered species list, but still remains a protected species. Deveaux Bank is the largest pelican rookery in South Carolina, thanks to its isolated location that provides protection from mammalian predators. Eastern Brown Pelicans prefer to nest in areas on the island that have sufficient high ground to avoid tidal flooding. You will use LIDAR data to identify areas of higher elevation on the island and create polygon zones surrounding those areas. Because of the Eastern Brown Pelican’s colonial nesting behavior, these zones will be classified as “highly sensitive” to disturbance from visitors. Goal After hearing the lecture and working through the exercises, you will be able to understand how scientific data, in this case LIDAR elevation contours, can be used for protected areas management. Objectives Import LIDAR data contours for the area Analyze bird nesting areas Create a “highly sensitive” polygon zone Import nautical chart data and locate entrance areas Impacts To Sensitive Habitats Exercise B: Using LIDAR Data to Define a Sensitive Zone
Impacts To Sensitive Habitats • Spatial Analyst • Use the Contour Surface Analysis function from the Spatial Analyst toolbar • ArcToolbox • Use the conversion tools to import LIDAR data into ArcView Tools to Use Exercise B: Using LIDAR Data to Define a Sensitive Zone • Summary of Process Steps • Load Spatial Analyst Extension –to be used in the exercise to analyze raw point LIDAR data • Import Raw Point LIDAR Data into ArcView –use ArcToolbox to convert data from floating point to raster grid format • Create LIDAR Contours –use Spatial Analyst to create contours from gridded LIDAR data • Select and Export 2-Meter Contours –use Select By Attributes to select all 2-meter contours and export them to a new shapefile • Create Sensitive Zone Polygons –use the Buffer Wizard to create 20-meter buffer polygons surrounding selected contours • Import Nautical Chart Data and Marina Locations –use ChartViewer extension to load BSB electronic charts • Locate Visitor Entrance Areas –visually overlay nautical chart data with Deveaux_Bank shapefile to determine channel depths adjacent to bank Data Deveaux_Bank.mxd ArcMap document raw_lidar_data.flt Floating Point LIDAR data file pelican1.shp Point shapefile containing pelican nesting locations pelican2.shp Point shapefile containing pelican nesting locations Deveaux_Bank.shp Polygon shapefile of Deveaux Bank location Marinas_utm.shp Point shapefile of marina locations in Charleston area 11521_1.kap Charleston Harbor and Approaches nautical chart
Impacts To Sensitive Habitats • For more information about Spatial Analyst, visit ESRI’s site at • www.esri.com/ • software/arcgis/ • arcgisxtensions/ • spatialanalyst/ • index.html • For more information about LDART, visit • www.csc.noaa.gov/ • crs/tcm/ • about_ldart.html Web Sites Exercise B: Using LIDAR Data to Define a Sensitive Zone • 1. Load Spatial Analyst Extension • Start ArcMap and open the Deveaux_Bank.mxd map document from the Sens_Hab folder. • In ArcMap, select Tools > Extensions. Make sure the box next to the Spatial Analyst extension is checked. Click on Close to return to the map document. • In order to use the tools associated with the Spatial Analyst, you will need to load the associated toolbars. Select View > Toolbars > Spatial Analyst. • The Spatial Analyst extension contains tools to solve complex spatial problems and allows you to perform certain functions such as hillshading and site location. In this exercise, the extension will be used to analyze the raw LIDAR data points. • 2. Import Raw Point LIDAR Data Into ArcView • On the Windows toolbar, select Start > Programs > ArcGIS > ArcToolbox to open the third component of ArcGIS: ArcToolbox.
Impacts To Sensitive Habitats • Grid – A geographic representation of the world as an array of equally-sized square cells arranged in rows and columns Glossary Terms Exercise B: Using LIDAR Data to Define a Sensitive Zone • 2. Import Raw Point LIDAR Data into ArcView (continued) • The raw points LIDAR data that have been downloaded for you is in a binary raster format that is not recognized by ArcGIS 8. In order to work with these data, you will need to convert them from the present format to a recognizable grid format using ArcToolbox. • In ArcToolbox, double-click on Conversion Tools > Import to Raster > Floating Point Data to Grid. To select the Input Float File, navigate to the Sens_Hab data directory, select raw_lidar_data.flt, and click Open. In the Output Grid dialog, click on the select file button, and type deveaux_lidar as the name of the Output Grid in the same directory. Once the program has finished processing the file, close ArcToolbox. • In ArcMap, click on the Add Data button , navigate to the sens_hab data directory and select the deveaux_lidar grid data file you just created. Click Add. Disregard the missing projection information message that pops up by clicking OK. The data are in the correct projection. • The LIDAR data for Deveaux Bank will be displayed in grayscale grid format. If you want to view the data in Pseudocolor format, double-click on the layer to bring up its properties window. Click on the Symbology tab and select any one of the many color ramps.
Impacts To Sensitive Habitats Exercise B: Using LIDAR Data to Define a Sensitive Zone • 3. Create LIDAR Contours • For this exercise, you will need to create elevation contours from the gridded data. The Spatial Analyst extension makes this conversion simple. Click on the Spatial Analyst drop-down menu and select Surface Analysis > Contour. • In the Contour dialog box, set the Input Surface to deveaux_lidar 2. Set the Contour Interval to 1 3. Set the Base Contour to 0 4. Set the Z Factor to 1 5. Save the Output Features as lidar_contours in the Sens_Hab data directory 6. Click OK 1 1 2 2 3 3 4 4 5 5 6 6
Impacts To Sensitive Habitats • In addition to contours, you could also use Spatial Analyst to derive the slope, aspect, and viewshed from the raw LIDAR elevation data. Did You Know? Exercise B: Using LIDAR Data to Define a Sensitive Zone • 3. Create LIDAR Contours (continued) • Contours of the LIDAR data will be created and displayed. Notice the difference between the position of the contours and the position of Deveaux Bank in the DOQQ. • What do you think caused this discrepancy between data sets? __________________ • ____________________________________________________________________ • ____________________________________________________________________ • ____________________________________________________________________ • You can reclassify the contours so that each elevation is symbolized by a different color. Bring up the Properties window for the lidar_contours layer. As in the last exercise, you will want to display Unique Values. This time, set the value field to contour. Don’t forget to uncheck the box next to <all other values> and then click on Add All Values. You can double-click on each line symbol to change its color if you wish. Now each change in elevation is denoted by a different color.
Impacts To Sensitive Habitats Exercise B: Using LIDAR Data to Define a Sensitive Zone • 4. Select and Export 2-Meter Contours • Now that you have created elevation contours from raw point LIDAR data, you will now want to select those contours that have an elevation of 2 meters. Click on Selection > Select By Attributes. You will want to create a SQL expression that will select all of the contour lines from the lidar_contours layer that will have a value of 2. Remember to click on Verify to check the validity of your expression. Once you have created a valid expression, apply the selection and close the window. • The area encompassed by the selected 2-meter contours represents the higher elevations found on the island. Recall that the Eastern Brown Pelican prefers to nest in higher elevations; therefore, you are in effect selecting those areas where the brown pelican is most likely to nest. • Export the selected contours to a new shapefile. Right-click on the lidar_contours layer, select Data > Export data. In the Export Data window, select to export selected featuresusing the same coordinate system as the source data and name the new shapefile selected_contours. Click OK to save the exported features and Yes to display the data in the map frame.
Impacts To Sensitive Habitats • Spatial Analyst also allows you to perform the same buffer function on the elevation GRID that you created Did You Know? Exercise B: Using LIDAR Data to Define a Sensitive Zone • 5. Create Sensitive Zone Polygons • You now have selected an area that encompasses the highest elevations on the island and, thus, the areas that are most likely to contain nesting pelicans. The features that you have selected are polylines; you want to create a sensitive zone polygon shapefile. Use the Buffer Wizard to create polygons that will contain the area bounded by the polyline contours. • Click Tools > Buffer Wizard. Buffer the features of selected_contours. Click Next. Create the buffers at a specified distance of 20 meters. Make sure Meters is selected as the distance units. Click Next. In the third window, choose to dissolve barriers between buffers and save the file as sensitive_zone in your sens_hab directory. Click Finish to create the buffer polygons. • To see how accurate your polygons are, add and turn on the pelican1 and pelican2 layers in your table of contents. These two shapefiles contain field-verified point locations of nesting pelicans. • Turn off all currently displayed layers.
Impacts To Sensitive Habitats • For more information on the Chart Viewer extension, visit: • www.csc.noaa.gov/ • products/chartview/ • Pyramids – Reduced resolution raster layers that record the original raster data in decreasing levels of resolution. Pyramids help to reduce the time it takes to display raster data Web Sites Exercise B: Using LIDAR Data to Define a Sensitive Zone • 6. Import Nautical Chart Data and Marina Locations • Click the Add Data button , navigate to the Sens_Hab data directory, and select the marinas_utm and Deveaux_Bank.shp layers from the directory. • The marinas layer is a point shapefile consisting of marina locations in the greater Charleston area; the Deveaux_Bank layer is a polygon layer digitized from the Rockville_SE DOQQ image. You may have to zoom out to see both layers. • Repeat the process to add a nautical chart for the area. In the Sens_Hab data directory, select the 11521_1.kap electronic chart file. Click Do Not Build Pyramids in the subsequent dialog box and then click OK; pyramid layers will not be necessary for this exercise. • The NOAA Coastal Services Center created the Chart Viewer extension as a tool to help bring digital nautical chart information into the GIS environment. The extension is already loaded on your computer and allows you to add BSB-formatted charts, just as you would any other data set. No special import procedure is necessary. • Most of the visitors to Deveaux Bank will want to travel a short distance (< 5 mi.) from their boat launch location. To determine where most of the visitors will be coming from, you will use the Select By Location function to select all of the marina locations that are within 5 miles from Deveaux Bank. Glossary Terms
Impacts To Sensitive Habitats Exercise B: Using LIDAR Data to Define a Sensitive Zone • 7. Locate Visitor Entrance Areas • Click on Selection > Select By Location. Choose to select those features in the marinas_utm layer that are within 5 miles of the deveaux_bank layer. • The Select By Location function selected only one marina: the Bohicket Marina located at the entrance to Seabrook Island. Zoom out to set the view extent to include both the selected marinas_utm and deveaux_bank shapefiles. • Examine the nautical chart. As you can see, the route that visitors will most likely take to get to Deveaux Bank from the Bohicket Marina is by navigating Rockville Creek and the North Edisto River. • Select and Zoom To the Deveaux_Bank layer. Turn on the sensitive_zone layer. Examine the nautical chart depths adjacent to the bank (you may need to zoom out to see this information more clearly). Keep in mind that visitors are most likely to enter the island where there is sufficient depth to navigate a boat to shore. • Which areas of the bank are most likely to be entrance areas? Which areas are the least likely? Are they near the sensitive zones you created earlier? ______________________________________________________________________________________________ • ______________________________________________________________________________________________ • ______________________________________________________________________________________________
END OF EXERCISE B Impacts To Sensitive Habitats • What would you put on an educational sign for the island? What Do You Think? • Design an educational sign that shows mapped results, the “highly sensitive” zone, images of the birds and their nests, and instructions for visitors to avoid these areas • Images of the birds can be found in your Student directory under the Sens_Hab folder Challenge Exercise Exercise B: Using LIDAR Data to Define a Sensitive Zone • 7. Locate Visitor Entrance Areas (continued) • Now that you have determined where visitors to the island are most likely to arrive, you could use this information to determine the best location for an educational sign. This could aid in the protection of the pelican species by containing a map that would delineate the boundaries of the sensitive zone you created. • When you have finished, select File > Save to save your map document. • If you have time, move on to the challenge step.
Impacts To Sensitive Habitats Exercise B: Using LIDAR Data to Define a Sensitive Zone Exercise Summary In this exercise you imported and integrated raster data into the ArcGIS environment using the Spatial Analyst extension. As you have seen, the applications of remotely sensed data, such as LIDAR, can be far-reaching. In using these data to define a sensitive zone based on a single habitat characteristic, you have successfully integrated yet another tool that is available to the coastal manager. In addition to defining existing habitats, LIADR data could also be used to delineate any potential pelican habitat. • p. 40 • What do you think caused this discrepancy between data sets? • The data sets were derived at two different time periods. • p. 44 • Which areas of the bank are most likely to be entrance areas? Which areas are the least likely? The northeastern area of the bank is the most likely entrance area. The least likely areas are located on the southern side of the bank, due to the shallow depths. There are several sensitive zones near the northeastern side of the bank where visitors are most likely to enter, but there are more sensitive zones on the southern side of the bank. Answers to Exercise Questions
Impacts To Sensitive Habitats Discussion: Overview of Management Applications • How many educational signs would you place on the island? • What other information would you include on the signs? • ___________________________________________________________________________________ • ___________________________________________________________________________________ • ___________________________________________________________________________________ • ___________________________________________________________________________________ • ___________________________________________________________________________________ • ___________________________________________________________________________________ • ___________________________________________________________________________________ • ___________________________________________________________________________________ • ___________________________________________________________________________________ • ___________________________________________________________________________________ • ___________________________________________________________________________________ • ___________________________________________________________________________________ • ___________________________________________________________________________________
Impacts To Sensitive Habitats Module Summary In this module, you learned about the sensitivity of specific coastal bird habitats and how to incorporated GIS practices to help alleviate human pressures on these species. In an effort to ease the human pressure on the bird habitats, you were asked to first examine the spatial nesting requirements of the different birds. Then, you focused on the identification and protection of the nesting habitat of the Eastern Brown Pelican through a series of spatial analyses.