Chapter 26
360 likes | 752 Views
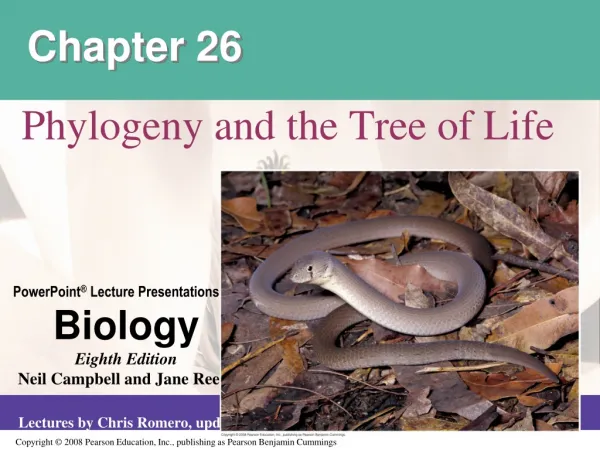
Chapter 26. Phylogeny and the Tree of Life. Overview: Investigating the Tree of Life. Phylogeny is the evolutionary history of a species or group of related species. The discipline of systematics classifies organisms and determines their evolutionary relationships .

Chapter 26
E N D
Presentation Transcript
Chapter 26 Phylogeny and the Tree of Life
Overview: Investigating the Tree of Life • Phylogeny is the evolutionary history of a species or group of related species. • The discipline of systematicsclassifies organisms and determines their evolutionary relationships. • Systematists use fossil, molecular, and genetic data to infer evolutionary relationships. • Taxonomyis the ordered division and naming of organisms.
Binomial Nomenclature • In the 18th century, Carolus Linnaeus published a system of taxonomy based on resemblances. • The two-part scientific name: Genusspecies. • The first letter of the genus is capitalized, and the entire species name is italicized • Both parts together name the species. This is the species specific epithet.
Hierarchical Classification • Linnaeus introduced a system for grouping species in increasingly broad categories. • The taxonomic groups from broad to narrow are domain, kingdom, phylum, class, order, family, genus, and species. • A taxonomic unit at any level of hierarchy is called a taxon.
Taxonomy:Hierarchical Organization:DomainKingdomPhylumClassOrderFamilyGenusspecies Species: Panthera pardus Genus: Panthera Family: Felidae Order: Carnivora Class: Mammalia Phylum: Chordata Kingdom: Animalia Domain: Eukarya Archaea Bacteria
Linking Classification and Phylogeny Evolutionary Relationships • Systematists depict evolutionary relationships in branching phylogenetic trees. • Their PhyloCode recognizes only groups that include a common ancestor and all its descendents. • A phylogenetic tree represents a hypothesis about evolutionary relationships. • Each branch point represents the divergence of two species. • Sister taxa are groups that share an immediate common ancestor.
Species Order Family Genus Pantherapardus Panthera Felidae Taxidea taxus Taxidea Carnivora Mustelidae Lutra lutra Lutra Canis latrans Canidae Canis Canis lupus Phylogenetic Trees Evolutionary Relationships
A rooted tree includes a branch to represent the last common ancestor of all taxa in the tree: Branch point (node) Taxon A Taxon B Sister taxa Taxon C ANCESTRAL LINEAGE Taxon D Taxon E Taxon F Common ancestor of taxa A–F Polytomy is a branch from which more than two groups emerge
What We Can and Cannot Learn from Phylogenetic Trees • Phylogenetic trees do show patterns of descent. • Phylogenetic trees do not indicate when species evolved or how much genetic change occurred in a lineage. • It shouldn’t be assumed that a taxon evolved from the taxon next to it. • Phylogeny provides important information about similar characteristics in closely related species.
Possible Phylogenetic Trees:Provide important information about similar characteristics in closely related species. D A B B C D C C B D A A (c) (a) (b)
Concept 26.2: Phylogenies are inferred from morphological and molecular data • Organisms with similar morphologies or DNA sequences are likely to be more closely related than organisms with different structures or sequences. • When constructing a phylogeny, systematists need to distinguish whether a similarity is the result of homology or analogy. • Homology is similarity due to shared ancestry. • Analogy is similarity due to convergent evolution.
Convergent Evolution - Similar Environmental Selecting Agents • Convergent evolution occurs when similar environmental pressures and natural selection produce similar /analogousadaptations in organisms from different evolutionary lineages. • Bat and bird wings are homologous as forelimbs, but analogous as functional wings. • Analogous structures or molecular sequences that evolved independently are also called homoplasies.
Homology can be distinguished from analogy by comparing fossil evidence and the degree of complexity. The more complex two similar structures are, the more likely it is that they are homologous. • Molecular systematicsuses DNA and other molecular data to determine evolutionary relationships. • Once homologous characters have been identified, they can be used to infer a phylogeny.
Cladisticsgroups organisms by common descent • A cladeis a group of species that includes an ancestral species and all its descendants. • Clades can be nested in larger clades, but not all groupings of organisms qualify as clades. • A valid clade is monophyletic, signifying that it consists of the ancestor species and all its descendants. • A paraphyleticgrouping consists of an ancestral species and some of the descendants. • A polyphyleticgrouping consists of various species that lack a common ancestor.
Cladistics - Groups Organisms using Evolutionary Relationships A A A Group I B B B C C C D D D Group III Group II E E E F F F G G G Paraphyletic group Polyphyletic group Monophyletic group / clade
Shared Ancestral and Shared Derived Characters • In comparison with its ancestor, an organism has both shared and different characteristics. • A shared ancestral characteris a character that originated in an ancestor of the taxon. • A shared derived characteris an evolutionary novelty unique to a particular clade. • A character can be both ancestral and derived, depending on the context.
Inferring Phylogeny from Shared Characters TAXA Lancelet (outgroup) Lancelet (outgroup) Salamander Lamprey Lamprey Leopard Turtle Tuna Tuna Vertebral column (backbone) 1 1 1 1 1 0 Vertebral column Hinged jaws 1 1 1 1 0 0 Salamander Hinged jaws CHARACTERS 1 0 0 0 1 1 Four walking legs Turtle Four walking legs 1 1 0 0 0 0 Amniotic (shelled) egg Amniotic egg Leopard 0 1 0 0 0 0 Hair Hair (b) Phylogenetic tree (a) Character table
Maximum parsimony assumes that the tree that requires the fewest evolutionary events (appearances of shared derived characters) is the most likely. • The principle of maximum likelihood states that, given certain rules about how DNA changes over time, a tree can be found that reflects the most likely sequence of evolutionary events. • The best hypotheses for phylogenetic trees fit the most data: morphological, molecular, and fossil. • Phylogenetic bracketing predicts features of an ancestor from features of its descendents.
Maximum Parsimony Mushroom Human Tulip 40% 0 30% Human 40% 0 Mushroom 0 Tulip (a) Percentage differences between sequences 5% 15% 5% 15% 15% 10% 25% 20% Tree 1: More likely Tree 2: Less likely (b) Comparison of possible trees
Phylogenetic bracketing - predicts features of an ancestor from features of its descendents: Lizards and snakes Crocodilians Ornithischian dinosaurs Common ancestor of crocodilians, dinosaurs, and birds Saurischian dinosaurs Birds
Front limb Hind limb Eggs (a) Fossil remains of Oviraptor and eggs (b) Artist’s reconstruction of the dinosaur’s posture
Concept 26.4: An organism’s evolutionary history is documented in its genome • Comparing nucleic acids or other molecules to infer relatedness is a valuable tool for tracing organisms’ evolutionary history. • DNA that codes for rRNA changes relatively slowly and is useful for investigating branching points hundreds of millions of years ago. • mtDNA evolves rapidly and can be used to explore recent evolutionary events. • Gene duplication increases the number of genes in the genome, providing more opportunities for evolutionary changes.
Like homologous genes, duplicated genes can be traced to a common ancestor. • Orthologous genesare found in a single copy in the genome and are homologous between species. • They can diverge only after speciation occurs. • Paralogous genesresult from gene duplication, so are found in more than one copy in the genome. • They can diverge within the clade that carries them and often evolve new functions.
Orthologous genes Ancestral gene Ancestral species Speciation with divergence of gene Orthologous genes Species A Species B Species A Gene duplication and divergence Paralogous genes Species A after many generations Paralogous genes
Molecular Clocks • A molecular clockuses constant rates of evolution in some genes to estimate the absolute time of evolutionary change. • Molecular clocks are calibrated against branches whose dates are known from the fossil record. • Neutral theorystates that much evolutionary change in genes and proteins has no effect on fitness and therefore is not influenced by Darwinian selection. • It states that the rate of molecular change in these genes and proteins should be regular like a clock.
Molecular Clocks 90 60 Number of mutations 30 0 30 60 90 120 0 Divergence time (millions of years)
Difficulties with Molecular Clocks • Irregularities result from natural selection in which some DNA changes are favored over others. • Estimates of evolutionary divergences older than the fossil record have a high degree of uncertainty. • The use of multiple genes may improve estimates.
Applying a Molecular Clock: The Origin of HIV • Phylogenetic analysis shows that HIV is descended from viruses that infect chimpanzees and other primates. • Comparison of HIV samples throughout the epidemic shows that the virus evolved in a very clocklike way. • Application of a molecular clock to one strain of HIV suggests that that strain spread to humans during the 1930s.
HIV Virus 0.20 0.15 Computer model of HIV Index of base changes between HIV sequences 0.10 Range 0.05 0 1900 1920 1940 1960 1980 2000 Year
Three Domain System EUKARYA Dinoflagellates Land plants Forams Green algae Ciliates Diatoms Red algae Amoebas Cellular slime molds Euglena Trypanosomes Animals Leishmania Fungi Sulfolobus Green nonsulfur bacteria Thermophiles (Mitochondrion) Spirochetes Chlamydia Halophiles COMMON ANCESTOR OF ALL LIFE Green sulfur bacteria BACTERIA Methanobacterium Cyanobacteria (Plastids, including chloroplasts) ARCHAEA
There have been substantial interchanges of genes between organisms in different domains. • Horizontal genetransferis the movement of genes from one genome to another. • Horizontal gene transfer complicates efforts to build a tree of life. • Some researchers suggest that eukaryotes arose as an endosymbiosis between a bacterium and archaean.
Review Monophyletic group A A A B B B C C C D D D E E E F F F G G G Paraphyletic group Polyphyletic group
You should now be able to: • Explain the justification for taxonomy based on a PhyloCode. • Explain the importance of distinguishing between homology and analogy. • Distinguish between the following terms: monophyletic, paraphyletic, and polyphyletic groups; shared ancestral and shared derived characters; orthologous and paralogous genes. • Define horizontal gene transfer and explain how it complicates phylogenetic trees. 5. Explain molecular clocks and discuss their limitations.