Download
1 / 19
190 likes | 387 Views
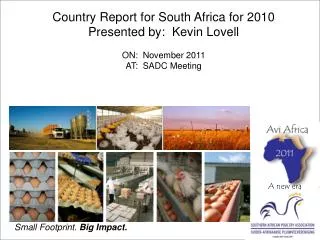
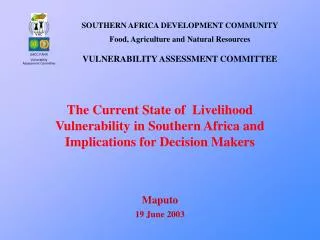
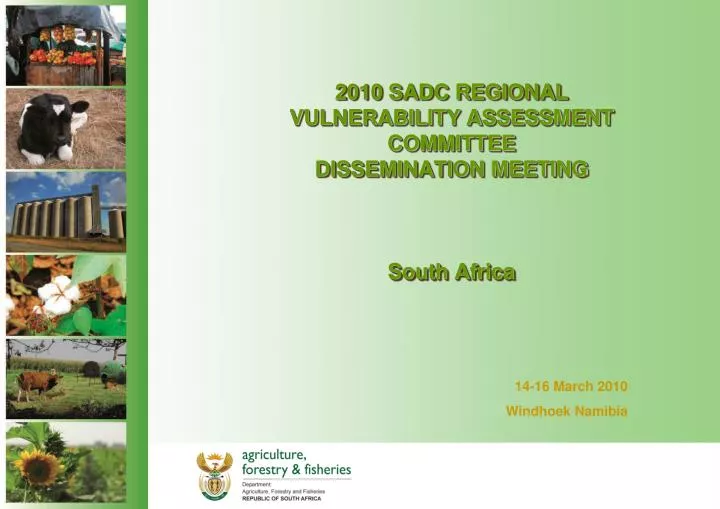
2010 SADC REGIONAL VULNERABILITY ASSESSMENT COMMITTEE DISSEMINATION MEETING South Africa. 14-16 March 2010 Windhoek Namibia. Presentation Structure. Introduction National Overview Overview of Current Year Hazards and Shocks Overview of Food Security and Vulnerability Situation

E N D
2010 SADC REGIONAL VULNERABILITY ASSESSMENT COMMITTEE DISSEMINATION MEETING South Africa 14-16 March 2010 Windhoek Namibia
Presentation Structure • Introduction • National Overview • Overview of Current Year Hazards and Shocks • Overview of Food Security and Vulnerability Situation • Suggestions: Policy and Development Programmes (short- and long-term) • Policy Analysis • Conclusion: Summary of Key Findings
Introduction Objective:To assess food in-security and vulnerability of households and communities within RSA Approaches Analysis of Hazards and Shocks Analysis of Food availability Analysis of Food Accessibility Analysis of Food Utilization Limitations: Still to Conduct a Baseline for Comparison MethodsandArea Covered Secondary Data Analysis - National
NATIONAL OVERVIEW OF CURRENT YEAR HAZARDS AND SHOCKS Floods and Diseases Provinces affected by floods > Gauteng, Mpumalanga, Kwazulu-Natal, Limpopo and North West Floods damaged, farm structures and crops In KwaZulu – Natal (Bulwer area) there were reports of limited damage to home gardens of emerging farmers and the damage was predominantly on maize Mpumalanga (Albert Luthuli, Lekwa and Emalahleni Local Municipalities), Animals were also affected by floods resulting in mortalities. 463 Outbreaks of RVF reported since February across the country. Approximately 3% of sheep and 1% of cattle, on infected farms died as a result of RVF Fortunately the cold winter conditions brought a halt to the outbreaks.
Drought and Veld Fires. Provinces affected by Drought included the Eastern Cape (Cacadu, Amathole) and Western Cape (Eden and some parts of the Karoo). Western Cape: Drought aid is still to be processed to support farmers Western Cape: Reported devastating fires which affected mostly the farming areas. KwaZulu-Natal: reported fire outbreaks destroying grazing land and woodlots in Uthungulu. Socio-Economic. 171000 jobs lost between the fourth quarter of 2009 and the first quarter of 2010. At least 79 000 of the jobs lost jobs were lost in the first quarter of 2010 (between January to March 2010) were in the formal non-agricultural sector Northern Cape , poor road conditions and distance hampering access to communal gardens areas by potential buyers. The Green Flood alert reported that people to have drowned and at least 1400 people displaced in Gauteng and North West (Taung). HAZARDS AND SHOCKS (cont.)
Weather Impact on Crop Production (DAFF, 2010)
Overview of the Food Security and Vulnerability Situation Expected commercial maize crop is 13,317 million tons, which is 10,51% more than the 12,050 million tons of the previous season. Projections for the current 2009/10 maize marketing season indicate a surplus of 2,203 million tons of maize at the end of April 2010. Thus, enough maize is available for local consumption and to meet export demand. Projections for the coming 2010/11 maize marketing season indicate a surplus of 3,748 million tons of maize at the end of April 2011.Thus, enough maize will be available for local consumption and to meet export demand. Projections for the current 2009/10 wheat marketing season indicate a surplus of 637 000 tons of wheat at the end of September 2010 when includingimports of 1,2 million tons. Projections for the coming 2010/11 wheat marketing season indicate a surplus of 584 000 tons of wheat at the end of September 2011, includingimports of 1,6 million tons. Still there are serious challenges in terms of ACCESS!!! (DAFF, 2010)
Food Availability: Non-Commercial Production • Less than a quarter of South African households (20,7%) are involved in agricultural production - grains (49,1%), fruit and vegetable production (47,7%), poultry (30,1%) and livestock (27,5%)- Instead a majority of the South Africans purchase their food!
Food Access: Employment by Industry Source: Stats SA QLFS (2010) • 171 000 Jobs lost (4Th Q 2009 – 1st Q 2010) • 79 000 Jobs lost (Jan - Mar 2010 in the Formal Non Agric. Sector)
Food Access: RSA Household Income Sources Stats SA GHS (2010)
Food Access: Food Prices Comparison between rural and urban food prices for selected food items (Source: NAMC, 2010)
Food Access by Province (2009) Source: Stats SA GHS (2010)
Food Utility: Nutrition Overview Notes: *No data Source: Department of Health, Food Consumption Survey (1999, 2005)
Food Utility: Water and Sanitation Source: Stats SA, GHS (2005, 2007 & 2009)
Suggestions: Policy and Development Programmes (short- and long-term)
Conclusion: Summary of Key Findings Current shocks for the current season included job loses (4,3 Million Persons Unemployed), high food prices (especially in rural areas), droughts, floods, veld fires, pests, HIV/AIDS. At least 1,3% or 171 000 jobs were lost between the fourth quarter of 2009 and the first quarter of 2010 (At least 79 000 of the jobs lost jobs were lost in the first quarter of 2010 between (January to March 2010) were in the formal non-agricultural sector) Impact of jobs lost estimated at almost 1 million more people affected/vulnerable to food insecurity! Expected commercial maize crop is 13,317 million tons, which is 10,51% more than the 12,050 million tons of the previous season. Projections for the current 2009/10 maize marketing season indicate a surplus of 2,203 million tons of maize at the end of April 2010. Thus, enough maize is available for local consumption and to meet export demand. Less than a quarter of South African households (20,7%) are involved in agricultural production - grains (49,1%), fruit and vegetable production (47,7%), poultry (30,1%) and livestock (27,5%)- Instead a majority of the South Africans purchase their food! RSA’s major income sources include salaries (63,5%) and grants (43,7%), business, remittances, and pension – Thus the jobs lost are a serious knock on the lives of many!