Download
1 / 34
340 likes | 448 Views
The role of Surface Pressure and SST observations in Reanalysis. Masao Kanamitsu Scripps Institution of Oceanography and Seung-On Hwang Korean Meteorological Agency. Reanalysis New Directions - 1.

E N D
The role of Surface Pressure and SST observations in Reanalysis Masao Kanamitsu Scripps Institution of Oceanography and Seung-On Hwang Korean Meteorological Agency
Reanalysis New Directions - 1 • Surface pressure only reanalysis pioneered by Whitaker et al (2004) using Ensemble Data Assimilation. • 3-dimensional atmospheric analysis may be possible back to late 1800’s.
Reanalysis New Directions - 2 • Reanalysis Observation System Simulation experiments by Bengtsson et al (2004). • Noted critical importance of radiosonde observation. • Surface only observation cannot provide good analysis.
Objective of this study • Importance of Surface pressure and SST observations in reanalysis • Whitaker et al. Ps and SST used. • SST Usually assumed to be error free. • AMIP runs show that inter-annual variations can be fairly accurately simulated with SST forcing only. • Examine the impact of SST for daily and seasonal mean analyses. • Does the accuracy of the analysis depend on time scale?
Experiment detail • NCEP/DOE analysis system with improved global model (3-D var) • Independent satellite retrieval • No surface data over land used • No SSM/I • Nov.1 – Feb.28 1997 and 1992 • 1997 strong ENSO event • 1992 near normal SST anomaly • Simple 5-member ensemble assimilation for surface pressure only and AMIP runs.
Results • Assume Analysis with all the observation with observed SST is “truth”. • Use Root Mean Square Difference as a measure of the goodness of the analysis.
Daily Z500 RMSD Whitaker et al. ~ 40 meter.
Seasonal Z500 RMSD Bengtsson et al. ~ 25 meter.
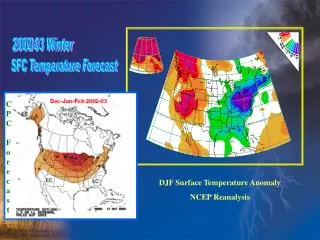
Summary of the impact of SST, Ps and Sonde observation in N.H.
Conclusions (1) • The impacts of observation and SST are different for different time scales. SST, which has long time scale, tends to have greater impact on long time scale analysis, while daily surface pressure observation tends to impact more on daily analysis. • The NCEP SSI seems to filter out long time scale information from surface pressure observation. We encourage research to understand the filtering characteristics of objective analysis schemes.
Conclusions (2) • Surface pressure observation is important for high frequency (daily) analysis of surface pressure and free atmospheric geopotential height. It also has positive impact on daily scale latent heat and cloudiness diagnosed from model. The impact on precipitation is small, but this can be strongly model dependent.
Conclusions (3) • SST is important for diagnostic fields, such as the surface fluxes and precipitation. • Inferior SST analysis will contaminates the good atmospheric analysis even over land. • For more accurate analysis, radiosonde observation is indispensable.
Full observation distribution. 00UTC Nov. 7, 1997 Simulated Ps observation distribution for 1915 Ocean Land
Simplified ensemble data assimilation • Simply perform ensemble data assimilation by perturbing the very first analysis guess field. • 5 member analysis • Ensemble mean of daily analysis • Runs without observation (AMIP) is also made in ensemble mode.