Download

1 / 45
450 likes | 607 Views
Rating Agency Meetings. March 2012. Topics For Today. Merger overview and update Regulatory update Business update Financial forecast . Company Attendees. Jim Judge, SVP & Chief Financial Officer, NSTAR Jeff Kotkin, VP Investor Relations, NU Phil Lembo, VP & Treasurer, NSTAR

E N D
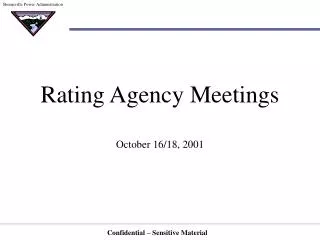
Rating Agency Meetings March 2012
Topics For Today • Merger overview and update • Regulatory update • Business update • Financial forecast
Company Attendees • Jim Judge, SVP & Chief Financial Officer, NSTAR • Jeff Kotkin, VP Investor Relations, NU • Phil Lembo, VP & Treasurer, NSTAR • Mike Ausere, VP Finance, NU • Mark Mueller, Manager Financial Planning, NSTAR • Emilie O’Neil, Director Corporate Finance & Cash Management, NSTAR
A Compelling Combination – Creates Largest Utility Company in New England NSTAR Gas Service Area Northeast Utilities Electric Service Area Northeast Utilities Gas Service Area Combined Service Territory • Larger, more diverse and better positioned company • Strong Balance Sheet and cash flows with enhanced business and financial profile • Best practice service quality capabilities to the largest customer base in New England • Highly experienced and complementary leadership team with proven track record • No premium or new debt issued in transaction • 3 million electric customers • 500,000 natural gas customers • 4,500 miles electric transmission • 72,000 miles electric distribution • 6,300 miles gas distribution NSTAR Electric Service Area
Building A Larger, More Diverse and Better Positioned Regulated Utility Business Rate Base By State / Federal Rate Base By Business Combined 2011 Rate Base: $12.4 billion
Management Organization Structure Tom May President & Chief Executive Officer Greg Butler General Counsel Christine Carmody Human Resources Jim Judge Chief Financial Officer David McHale Chief Administrative Officer Joe Nolan Corporate Relations Lee Olivier Chief Operating Officer
Creates A Company That… • Will focus on providing outstanding customer service • Has diversified customer, economic and regulatory risks • Invests in core regulated utility rate base; primarily transmission • Is committed to strong credit quality, increasing cash flows and adequate liquidity • Values a rigorous cost discipline and conservative financial approach • Builds constructive regulatory relations • Creates long-term value
Status of Merger Approvals Securities and Exchange Commission Shareholders Department of Justice Federal Communications Commission Federal Energy Regulatory Commission Maine DPUC Nuclear Regulatory Commission Approvals Received Determined Not To Have Jurisdiction New Hampshire PUC Connecticut PURA (expected April 2) Massachusetts DPU (expected April 4) Applications Pending
Massachusetts Settlement Agreements – Key Provisions • Settlement Agreement – MA Attorney General and DOER (Feb. 15, 2012) • One-time $21M rate credit (NSTAR Elec. $15M, Gas $3M, WMECo $3M) • Distribution rate freeze until 2016 – does not apply to transmission rates, exogenous items or rate reconciling mechanisms (pension adjustment mechanism, bad debts, decoupling (WMECo), energy efficiency, etc) • Recovery of lost base revenues (NSTAR Electric) • Hurricane Irene & October Nor’easter Storm costs recoverable in rates • NSTAR Electric – $38M recovered over 5 years commencing 1/1/14 with Prime Rate carrying charge • WMECo – recovery as approved by the DPU in its last rate order • Safety & Reliability program spending and recovery of $15M/yr (NSTAR Electric) • Amortization of merger-related costs (for rate-making) over 10 years • Settlement Agreement – MA Department of Energy Resources (DOER) • 15-year contract for energy related to 129MW (27.5%) of Cape Wind (NSTAR) • Costs fully recoverable in rates with 4% remuneration • Issue RFP for 10-year “Mass. Qualified” solar contracts for up to 10MW (NSTAR) • DPU Decision on April 4th
Connecticut Settlement Agreement – Key Provisions • Settlement Agreement – CT Attorney General and Office of Consumer Counsel (March 13, 2012) • One-time $25M rate credit for CL&P customers • Distribution rate freeze until December 1, 2014 – does not apply to rate reconciling mechanisms, transmission rates, exogenous items or trackers currently in place • Hurricane Irene & October Nor’easter Storm costs recoverable in rates • Recovery limited to $40M less than total storm costs ($263.3M) • 6 year recovery period commencing 12/1/14 • System Resiliency Program – Multi-year plan for $300M of spending • $100M of spending and $25M of revenue recovered in rates during 2013-2014 • $15M set aside to advance state energy goals (e.g. energy efficiency, electric vehicles, microgrids and renewable projects) • PURA Decision on April 2nd – Draft decision on March 26, 2012
Significant Portion of Rates Unaffected by Distribution Rate Freeze NSTAR Electric • Transmission Rate • Energy Supply Charge • Tracker Charges • Rate Decoupling Mechanism • Pension Adjustment Mechanism • Energy Efficiency Factor • Lost Base Revenues • Transition Charge • Bad Debt Recovery Factor Trackers 14% Transmission 9% Base 25% Energy 52% CL&P Trackers 6% Transmission 9% Base 34% Energy 51%
Excellent Transmission Opportunities into Largest New England Load Centers Hydro-Québec- HVDC Line • Northeastern Massachusetts (MA): • Greater Boston Solution (under consideration) Connecticut Borders (MA, RI): NEEWS Projects Under Way • Southeastern Massachusetts (MA): • Cape Cod Canal Line (Siting Approval in April) • Mid Cape Line (under consideration) Load Center Populations (1) Greater Boston: 4,600,000 Hartford: 1,200,000 Fairfield County: 900,000 Southwest Connecticut Reliability: Projects Complete ___________________________ Source: IHS Global Insight Winter 2009 – 2010, US Markets: State Economies, U.S. Census Bureau 2009 estimates.
NEEWS Projects – Status Update Greater Springfield Reliability Project SPRINGFIELD Interstate Reliability Project HARTFORD Central Connecticut Reliability Project 345-kV Substation Generation Station 345-kV ROW 115-kV ROW • Greater Springfield Reliability Project • Substation construction commenced in MA in December 2010; in CT in summer 2011 • Projected in-service: late 2013 • Total projected NU cost: $718 million • Project more than 55% complete as of 2/24/12 Under Construction • Interstate Reliability Project • Joint project with National Grid (NU in CT; NGrid in MA & RI) • ISO-NE confirmed need: August 2010 • Siting application filed in CT in December 2011 • Siting decisions: Connecticut decision in early 2013; others by end of 2013 • Commence construction: late 2013/early 2014 • Projected in-service: late 2015 • Total projected NU cost: $218 million In Siting/Assessment • Central Connecticut Reliability Project • ISO NE expected to issue preliminary need results and transmission solutions in 2013 • Projected in-service: 2017 • Total projected NU cost: $301 million In Planning Phase
Cape Cod Canal Transmission Line • New 345kV, 18 mile overhead transmission line • NE-ISO approved the line for reliability • January 2012 Energy Facilities Siting Board (EFSB) & the Cape Cod Commission approved the line, (EFSB) order expected in April • Cost estimated at $110M-$120M • Construction 2012-2013 • In-service early 2013 • FERC ROE of 11.64% New 345kV Transmission Line Cape Cod Canal Existing Transmission Line
Northern Pass Transmission Project Will Provide Significant Environmental and Economic Benefits to the Region • To be owned by Northern Pass Transmission LLC • 1,200 MW carbon free power, Northern terminus of DC line at Des Cantons (Québec), southern terminus in Franklin (New Hampshire) • 345kV AC leg from Franklin to Deerfield, NH • “Participant funded” TSA approved by FERC • Permitting process continues with U.S. DOE, U.S. Forest Service • Continued progress in securing alternate route in northern New Hampshire • Community outreach ongoing • Eminent domain legislation signed by NH Governor Lynch • Capital cost estimate for US segment - $1.1B • Completion projected for fourth quarter 2016 Des Cantons Franklin Deerfield HVDC Line HVDC Converter Station 345-kV Line Existing Deerfield Substation
Transmission Capital Expenditures (Combined) $623 $598 $595 $465 In Millions
Review of FERC-Approved Transmission ROEs 13.10% 12.89% 12.64% 12.56% 11.64% 11.14% Local Network Service Tariff ROE NE RTO Incentive adder of 50 basis points on PTF assets ISO-NE Planned Regional PTF projects in-service before 1/1/09 (D.C. Circuit Court rejected appeal on 1/29/10) Middletown-Norwalk advanced technical underground cable system - NU 125 basis point NEEWS incentive (request for reconsideration denied by FERC on 6/28/11) - NU 142 basis point Northern Pass incentive (request for reconsideration denied by FERC on 8/5/11)
Overall Positive JD Power Customer Satisfaction Results 2011 JD Power Electric Company Survey 2011 JD Power Gas Company Survey
Regulatory Update - Connecticut CL&P Yankee Gas • Two-year rate plan approved 6/29/11 • Initial $0.5MM rate decrease effective 7/20/11 and $6.7MM rate increase effective 7/1/12 • Modified ADIT ruling added approximately $700,000/year in revenues • Added $54 million Waterbury-Wallingford line to rate base • Approved increase to $40 million/year in pipe replacement expenditures • 8.83% ROE and 52.2% equity in capital structure (earned 9.3% in 2011) • Two-year CL&P rate plan approved 6/30/10 • $63.4 million rate increase and reduced depreciation effective 7/1/10 • $38.5 million increase effective 7/1/11 • Cash increase deferred until 1/1/11; recovery complete as of 6/30/12 • 9.4% authorized ROE (earned 9.4% in 2011) • 49.2% equity in capital structure
Regulatory Update – New Hampshire Distribution Generation • Fully tracking cost recovery with same capital structure as Distribution • 9.81% authorized ROE • Per legislation, all prudently incurred Clean Air Project (Scrubber) costs recoverable from customers • Scrubber in-service 9/28/11, project expected to be fully complete in mid-2012, $35M below $457M budget • Temporary rates expected to take effect 4/1/12 reflecting about 2/3rds of total costs • Full costs expected to be reflected in energy rates as of 1/1/13 following regulatory review in 2nd half 2012 • Helps PSNH serve the 64% of overall load that has not switched to competitive suppliers • Sharply reduced cap-ex going forward • Five year settlement effective 7/01/10 through 6/30/15 • $45.5 million increase on 7/1/10 • $2.3 million decrease on 7/1/11 due to expiration of recoupment period • Projected increases of $6.5 million on 7/1/12 and $11.1 million on 7/1/13 for net plant additions • 9.67% ROE on authorized equity ratio of 52.4% (combined D&G ROE of 9.7% in 2011)
2011 Tropical Storm Irene and October Nor’easter Impacts • CL&P – Recovery stipulated in March 13, 2012 Settlement Agreement • Will limit recovery to $40M less than total storm costs (i.e. $223.3M) • Costs recoverable in rates over a six year period beginning in 12/1/2014 • NSTAR – Recovery stipulated in February 15, 2012 Settlement Agreement • Costs recoverable in rates over a five year period with a carrying charge (prime rate) beginning in 2014 • WMECo – Recovery stipulated in February 15, 2012 Settlement Agreement • Costs recoverable in rates under storm recovery mechanism approved by DPU in last rate case • PSNH – Currently recovering $9.3 million/year through distribution rates. Expect to request recovery of deferred storm costs, below, in 2013
Natural Gas: A Compelling Growth Opportunity Price Differential Forecast $ per MMBTU • Yankee Gas has experienced 33 percent increase in firm gas sales since 2006 • WWL project in CT: • Expands natural gas access, removes gas constraints • Pursues further oil-to-gas conversions • Accelerates cast iron and bare steel pipe replacement to $40 million/year • Increasing penetration to 50 percent would yield long-term benefits • Significant customer savings • Reduced emissions • Reduction in oil demand • In 2010, Yankee Gas converted approximately 1,000 single-family homes and multi-unit apartments to natural gas. • In 2011, that number doubled to 2,000 • In 2010, NSTAR Gas converted 867 single-family homes and multi-unit apartments to natural gas. • In 2011, that number more than doubled to 2,020. Price differentials, can lead to homeowner savings of $1,000 - $1,500 per year CT Wholesale Propane CT Wholesale #2 Heating Oil Nominal $/MMBtu Difference increases from $9 to $28 per MMbtu Henry Hub + Tport Natural gas penetration vs. other states NJ NY RI MA CT
Electric Distribution Companies – Return on Equity Connecticut Light & Power NSTAR Electric 11.6% Allowed 9.4% 11.3% 9.4% 10.8% Allowed 10.5%+/-2% 7.9% 7.3% PSNH WMECO 10.2% 9.7% Allowed 9.67% -9.81% Allowed 9.6% 9.0% 8.4% 7.2% 4.6%
Gas Distribution Companies – Return on Equity NSTAR Gas Allowed 13.0% 7.12% 6.88% 6.47% Yankee Gas 9.3% 8.6% Allowed 8.83% 6.6%
Post Merger – Financial Policies • Maintain long-term, adequate credit facilities with high quality banks • Expect to have a new multi-year NU consolidated credit facility in place by mid-September • Continue to maintain short-term liquidity facilities at multiple entities • Establish a NU commercial paper program if cost effective • Maintain strong credit metrics and conservative equity ratios at each Operating Company and at the consolidated level • Capital programs at each entity will be financed primarily by the entities own cash flows and balance sheet • Internal dividend policy will be conservative and consistent, while external payout will be moderate and grow in-line with earnings
Well Established, Diverse Bank Group Support Revolving Credit Facilities NSTAR NU CL&P
EPS 2011 total dividend per share Dividend per share EPS NSTAR Expect to Continue Each Company’s Long History of Earnings Growth and Conservative Dividend Payouts • Post-merger dividend increases expected to be in-line with earnings growth • Target 50-55% equity levels at operating subs • Maintain common equity ratios appropriate for strong rating level NSTAR and NU Earnings and Common Dividends: 2009-2011 NU $2.652 $2.561 $2.382 $2.37 $2.161 $1.91 Per Share Per Share $1.70 $1.60 $1.50 $1.303 $1.10 $1.025 $0.95 1 Excludes NU tax settlement, NU-NSTAR merger costs 2 Excludes merger costs and CL&P storm fund reserve 1 Excludes merger costs, MATEP sale and RCN tax adjustment 2 Excludes merger costs
Integration Planning – Well Planned, Controlled and Executed • Formal integration planning kicked off in February 2011 • Extensive involvement of NU and NSTAR officers, directors and managers • 11 functional teams; over 175 subject matter experts involved • Process coordinated and supported by experienced outside consultants • Objectives and focus of integration planning on: • Preparing for merger close (planning and execution of Day One requirements) • 129 Day One action items identified and completed pending merger close • Developing deep understanding of both companies’ “as-is” operations and organization, and identifying significant integration opportunities • Parallel process to develop high-level organization structure and select the next level of officers by early April
Projected Net Merger Savings $784 Million in First Ten Years $137.3 $125.1 $118.6 $112.1 $105.6 $99.0 $90.5 In Millions $74.3 $52.9 $32.8 Note: Savings reflected above exclude $164.3 million merger integration costs.
Key Takeaways • Very enthusiastic and confident about the merger • A truly compelling transaction combining two very strong companies with complementary skill sets • Offers significant customer and environmental benefits • Strong commitment to credit quality • Strong overall financial condition combined with a low-risk, well diversified business profile • Track record of top performance
Post-Close Organizational Chart* President & Chief Executive Officer Tom May General Counsel Greg Butler Senior Vice President Human Resources Christine Carmody Chief Financial Officer Jim Judge Chief Administrative Officer David McHale Senior Vice President Corporate Relations Joe Nolan Chief Operating Officer Lee Olivier Federal Legislative Affairs Compensation Business Financial Services & Corporate Performance Mgmt Supply Chain, Real Estate & Prop. Management Media Relations Transmission Business Unit Benefits & Human Resources Operations Gas Business Unit Corporate Communications Regulatory Policy (FERC) Information Technology Investor Relations Employee & Labor Relations NSTAR Gas Yankee Gas Customer Care Ops & Transmission Communications & Community Relations Internal Audit & Security Treasurer NSTAR Electric Diversity, Inclusion & Ethics Energy Supply State Legislative & Regulatory Affairs Deputy General Counsel Controller & Chief Accounting Officer Connecticut Light & Power Organization & Talent Development Corporate Strategy & Environmental Affairs Deputy General Counsel Regulatory Affairs LegislativeAffairs Financial Planning & Analysis Public Service of New Hampshire Human Resources Consulting Unregulated Businesses Secretary/Compliance Western Massachusetts Electric Rates & Revenue Requirements Integration Planning Operations Services * Announced February 23, 2012
Transmission Year-End Rate Base Forecast $4,747 $4,416 $4,120 $3,823 In Millions