Download
1 / 18
180 likes | 374 Views
Feeding Relationships - Pyramids. Showing feeding relationships quantitatively (in numbers). What Food Chains and webs don’t tell us. A food chain tells us what eats what and shows the movement of energy

E N D
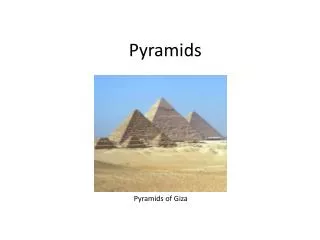
Feeding Relationships - Pyramids Showing feeding relationships quantitatively (in numbers).
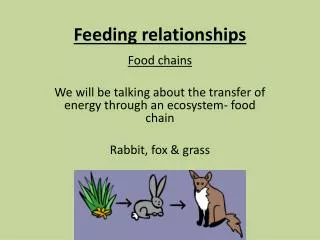
What Food Chains and webs don’t tell us • A food chain tells us what eats what and shows the movement of energy • Food chains do not tell us how many organisms are involved, how much their mass is, or how much energy is transferred from organism to organism. • We use pyramids to show us values associated with each organism.
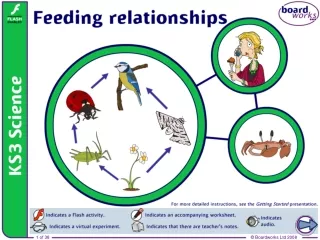
Pyramids of number • This shows us how many organisms are involved at each feeding (trophic) level. • Like a food chain a pyramid always starts (at the bottom) with a producer (plant) and builds itself up in the same order as a food chain. • Each block is in scale to show the numbers in each level.
Practicing Perfect Pyramids Please! • Try the following on graph paper. Go back and check the rules. • 1. 8000 rose leaves 1000 greenfly (aphids)200 ladybirds100 spiders • 2. 5000 oak leaves, 2000 caterpillars, 100 sparrows, 3 sparrow hawks • 3. 3000 blades of grass, 200 rabbits, 20 foxes, 400 fleas
More biomass pyramids • Pyramids of Biomassshow the mass of each organism on each level. The more the mass the wider the level. • For instance one pike has a similar mass to 3 water beetles which is why it's level is almost the same as the beetles.
Pyramids of energy • These always are pyramid shaped. • These show the transference of energy up the feeding levels. • Energy should be lost as you move up the pyramid. Can you remember why?.
What happens to energy? • Flow of energy through a food chain. As energy passes to a higher tropic level, approximately 90% of the useful energy is lost. • High tropic levels contain less energy and fewer organisms than lower levels.
What happens to energy? • At each tropic level in a food chain, energy is used by the organisms at that level to maintain their own life process. • It is estimated that in going from one tropic level to the next, about 90 % of the energy is lost.In moving to the next tropic level, only 10 % of the original energy is available. By the third tropic level only 1% of the energy is available.