Download
1 / 14
140 likes | 333 Views
Batch kernel SOM and related Laplacian methods for social network analysis. Presenter : Lin, Shu-Han Authors : Romain Boulet, Bertrand Jouve, Fabrice Rossi, Nathalie Villa. ˜. Neurocomputing 71 (2008). Outline. Motivation Objective Methodology Experiments Conclusion

E N D
Batch kernel SOM and related Laplacian methods for social network analysis Presenter : Lin, Shu-Han Authors : Romain Boulet, Bertrand Jouve, Fabrice Rossi, Nathalie Villa ˜ Neurocomputing 71 (2008)
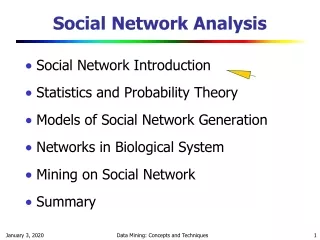
Outline • Motivation • Objective • Methodology • Experiments • Conclusion • Personal Comments
Motivation • Peasants of French medieval society about 90% of the population, but their community are anonymous related to a master, so • To extract a community structure (degree distribution, the number of components, the density, etc.) • To provide a organization of these small homogeneous social group • Could help historians to have a synthetic view of the social organization of the peasant communities during the Middle Ages. 3 Fig. social network
Objectives Fig. Final self-organizing map (7*7 square grid) • To explore the structure of a medieval social network modeled trough a weighted graph. • Defines perfect communities and uses spectral analysis of the Laplacian to identify them. • Implements a batch kernel SOM which builds less perfect communities and maps them. • Results are compared and confronted to prior historical knowledge. 4 Fig. perfect communities
Methodology – perfect community • Laplacian method • Spectral properties of the Laplacian (to find the perfect community) 5
Methodology – perfect community (Cont.) • Clustering through the search of perfect communities • The perfect community is a subgraph, which all its vertices are • pairwise linked by an edge • Has exactly the same neighbors outside the community • The rich-club occurs when the vertices with highest degree from a dense subgraph with a small diameter. • The central verticesis a set of vertex which connect the whole graph. 6 Fig. perfect communities (circles), the rich-club (rectangle) and central vertices (squares).
Methodology – batch kernel SOM • (Dis)Similarity measure : Almost perfect communities to graph cuts • Diffusion kernel : define a kernel that maps the vertices in a high-dimensional space 7
Experiments • (A) Simple representation of the graph by Tulip • Two persons are linked together if: • they appear in a same contract, • they appear in two different contracts which differ from less than 15 years and on which they are related to the same lord or to the same notary. 9 Fig. Representation of the medieval social network with force directedalgorithm.(615 vertices and 4193 edges) Fig. Cumulative degree distribution (solid) of the weighted graph
Experiments (Cont.) • (B) Clustering the medieval graph into perfect communities and rich-club Fig. density of the induced subgraph as a function of the number of highest degree vertices (log scale) Fig. green level of the disk encodes the mean date of the contracts inwhich the members of the community are involved (fromblack, 1260, to white, 1340). 10 Fig. number of components of the subgraph of perfect community and rich-club as a function of the number of vertices with high betweenness measure added
Experiments (Cont.) Fig. Graph of the perfect communities by geographical locations (yellow: Flaugnac, blue: Saint-Julien, green: Pern, pink: Cornus, red: Ganic andorange: Divilhac). 11
Experiments (Cont.) • (C) Mapping the medieval graph with the SOM Fig. Final self-organizing map (7*7 square grid). Fig. Mean date for each cluster from black, 1260, to white, 1340. 12 Self-organizing map of the main cluster.
Conclusions • The two approach can both provide elements to help the historians to understand the organization of the medieval society. • The two approach have distinct advantages and weaknesses. • Kernel SOM can provides a notion of proximity, organization and distance between the communities. • Kernel SOM organize all the vertices of the graph (not only the vertices that belong to a perfect community). • Perfect community approach is more reliable for local interpretations. • The definition of a perfect community is restrictive.
Personal Comments • Advantage • Macroscopic view • Drawback • Understanding problem • Detail • Relationship • Application • Historians’ study