
Uploaded by
armen
1 SLIDES
82 VIEWS
10LIKES
Predictive Evaluation of Apixaban Exposure Model
DESCRIPTION
Explore the accuracy of a model for apixaban exposure through a comparison of predicted percentiles with observed statistics. Probability analysis assesses reliability.
Download
1 / 1
Download Presentation 
Predictive Evaluation of Apixaban Exposure Model
An Image/Link below is provided (as is) to download presentation
Download Policy: Content on the Website is provided to you AS IS for your information and personal use and may not be sold / licensed / shared on other websites without getting consent from its author.
Content is provided to you AS IS for your information and personal use only.
Download presentation by click this link.
While downloading, if for some reason you are not able to download a presentation, the publisher may have deleted the file from their server.
During download, if you can't get a presentation, the file might be deleted by the publisher.
E N D
Presentation Transcript
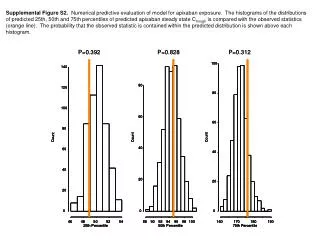
Supplemental Figure S2. Numerical predictive evaluation of model for apixaban exposure. The histograms of the distributions of predicted 25th, 50th and 75th percentiles of predicted apixaban steady state Ctrough is compared with the observed statistics (orange line). The probability that the observed statistic is contained within the predicted distribution is shown above each histogram.
More Related