Download
1 / 31
310 likes | 423 Views
This paper discusses the Cumulative Distribution Approach to classifying forest stands, highlighting its significance in organizing observations and facilitating communication. It recognizes the continuum of stand structure with few distinct breaks, which can lead to skewed classifications. The proposed approach utilizes data from 424 sample plots, employing mathematical algorithms and cumulative frequency distributions of basal area and tree density. Key design criteria ensure classifications are consistent, recognizable, and measurable, enhancing resource interpretations and management practices.

E N D
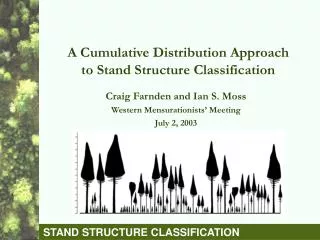
A Cumulative Distribution Approach to Stand Structure Classification Craig Farnden and Ian S. Moss Western Mensurationists’ Meeting July 2, 2003
Why Classify? It helps us to organize our observations of complex systems and to learn from those observations It facilitates communication between individuals: a given class label infers a set of attributes that are commonlyunderstood
Implicit Assumptions Recognized that: • Stand structure is a continuum • There are few if any obvious breaks upon which to base classes • Perceptions of what stands should look like can seriously skew a classification (“textbook” stand structures)
Design Criteria • Units must be internally consistent • Units must be readily recognizable • Sufficient number of units to facilitate interpretations • Classification must be definitive
Design Criteria • Classification attributes should be easy to measure or assess for general applicability • System should be open to improvement or refinement through sub-division and/or re-fitting • Separable with respect to diameter distributions and species composition
The Cumulative Distribution Approach to Classification • Current classification built on 424 sample plots • Uses mathematical algorithm to find stands with similar structures • Pattern recognition based on two cumulative frequency distributions: • Basal area (m2/ha) • Trees/ha
The Cumulative Distribution Approach to Classification 40 35 30 25 20 Basal Area (m2/ha) 15 10 5 0 0 10 20 30 40 50 60 70 80 Tree DBH (cm)
The Cumulative Distribution Approach to Classification 4000 3500 3000 2500 Trees/ha 2000 1500 1000 500 0 0 5 10 15 20 25 30 Tree DBH (cm)
100 75 Trees/ha Percentile 50 25 0 0 5 10 15 20 25 30 Tree DBH (cm) Methodology…
100 75 Trees/ha Percentile 50 25 0 0 5 10 15 20 25 30 Tree DBH (cm) Methodology…
Methodology… T= ∑distance between all pairs WGij = ∑within group pairs BGij = T - WGij
Methodology… For each possible move, calculate: New WGij ∆BGi Rij =Wgij/ ∆Bgi Find Rminij
Results - Reference Distributions 10000 9000 8000 7000 6000 Trees/ha 5000 4000 3000 2000 1000 0 0 5 10 15 20 25 Tree DBH (cm) C1 C3 C5 C7 C9 C11 C13 C15 C17 C2 C4 C6 C8 C10 C12 C14 C16
Results - Reference Distributions 60 50 40 30 Basal Area (m2/ha) 20 10 0 0 10 20 30 40 50 60 70 80 90 100 Tree DBH (cm) C1 C3 C5 C7 C9 C11 C13 C15 C17 C2 C4 C6 C8 C10 C12 C14 C16
Classifying Stands • Plot cumulative distributions and compare to reference distributions
60 13 15 17 50 12 14 16 40 Basal Area (m2/ha) 30 20 10 0 0 10 20 30 40 50 60 70 80 90 100 Tree DBH (cm) Classifying Stands
Classifying Stands • Plot cumulative distributions and compare to reference distributions • Use computer software (planned) • Use keys in field guide
Classifying Stands 17 Y B25>37 OR B80>8 Y 16 Y B40>19.5 AND B20>27.5 N 15 N Y 15 B40 >18 Y B10<32.5 15 Y B60>5 AND B10<35 N 12 N Y 15 B0>34 N B0>30 OR B15>26 Y 14 N Y B35>12 KEY "A" B10>19 OR B20>16 14 N N 13 N
Classifying Stands Basal Area (m2/ha) Tree DBH (cm)
Classifying Stands • Plot cumulative distributions and compare to reference distributions • Use computer software (planned) • Use keys in field guide • Use Air Photo Interpretation
Classifying Stands Class 14 Class 15 Class 17
Classifying Stands • Plot cumulative distributions and compare to reference distributions • Use computer software (planned) • Use keys in field guide • Use Air Photo Interpretation • Recognize through familiarity
Classifying Stands 4 12 2 16 6
Classifying Stands 14 16
Unresolved Issues • Number and distribution of classes • Use of discrete point samples versus composite samples • Class hierarchy • Species • Spatial distribution and complex • Small tree frequency
Conclusions • System has great potential • Enhanced resource interpretations • Enhanced treelist imputation • Enhanced broad scale prescriptive abilities • Appears to be robust and defensible • Should be exportable with minimal modifications • New and untested - guinea pigs required
Documentation Field guide and poster Lignum Limited web site: www.lignum.com go to publications
Acknowledgements • This project was undertaken as part of the Lignum Ltd. IFPA • Funding for this project was provided by Forestry Innovation Investment (FII), a forestry investment mechanism of the Gov’t of BC, and Forest Renewal BC
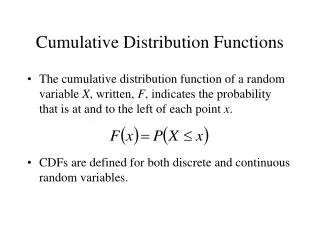


![Cumulative distribution [%]](https://cdn1.slideserve.com/2142714/slide1-dt.jpg)