X AND R CHART EXAMPLE IN-CLASS EXERCISE
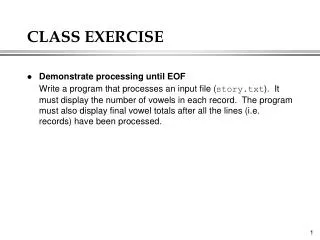
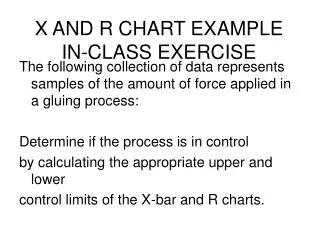
X AND R CHART EXAMPLE IN-CLASS EXERCISE. The following collection of data represents samples of the amount of force applied in a gluing process: Determine if the process is in control by calculating the appropriate upper and lower control limits of the X-bar and R charts.

X AND R CHART EXAMPLE IN-CLASS EXERCISE
E N D
Presentation Transcript
X AND R CHART EXAMPLEIN-CLASS EXERCISE The following collection of data represents samples of the amount of force applied in a gluing process: Determine if the process is in control by calculating the appropriate upper and lower control limits of the X-bar and R charts.
Example of x-bar and R charts: Step 1. Calculate sample means, sample ranges, mean of means, and mean of ranges.
Example of x-bar and R charts: Step 2. Determine Control Limit Formulas and Necessary Tabled Values
Example of x-bar and R charts: Steps 3&4. Calculate x-bar Chart and Plot Values
Example of x-bar and R charts: Steps 5&6: Calculate R-chart and Plot Values