Understanding Stellar Characteristics: Mass, Size, and the Hertzsprung-Russell Diagram
Explore the fascinating world of stars, focusing on their sizes, masses, and luminosity. We delve into the Hertzsprung-Russell diagram, a vital tool in astronomy that correlates a star's temperature and luminosity, helping us understand their formation and evolution. The relationship between spectroscopic data and stellar classification will be examined, detailing how spectral lines reveal critical information such as a star's type and distance. Additionally, we will uncover the significance of binary star systems in mass determination and what it teaches us about stellar physics.

Understanding Stellar Characteristics: Mass, Size, and the Hertzsprung-Russell Diagram
E N D
Presentation Transcript
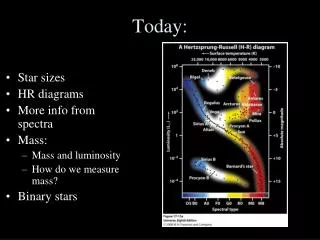
Today: • Star sizes • HR diagrams • More info from spectra • Mass: • Mass and luminosity • How do we measure mass? • Binary stars
Stars come in various sizes Let’s do a few calculations to get a feel for the range of stellar sizes:
Understanding stellar data • We have a huge pile of data about the stars. What do we need to do to understand it? • Make a graph! • What should we graph? • Two quantities differ substantially from star to star: temperature and luminosity. • If we make a graph relating these two quantities we can understand the relationship between L and T. As a bonus we also create a plot that helps us understand how stars form, evolve and die. • This is a really important graph, perhaps the most important in all astronomy!
Hertzsprung-Russell diagrams • 1911: Ejnar Hertzsprung made a plot of absolute magnitude (luminosity) as a function of color (temperature). • 1913: Henry Norris Russell made a similar plot but used spectral class instead of color. • This plot is called a Hertzsprung-Russell or HR diagram.
More information in spectra • Surface temperature largely determines which lines are prominent in a star’s spectrum. • Classifying stars by spectral type is equivalent to categorizing them by surface temperature. • Problem: 5800K surface temperature can mean a star is a white dwarf, a main-sequence star, a giant or even a supergiant… • It turns out that details in the spectrum of a star help us solve this problem. • Can determine type of star. • Can even be used to determine distance to star.
Size from spectra • Balmer lines are narrow in large, luminous supergiants and broad in small, less luminous main-sequence star. • Due to pressure broadening. • Higher density (small stars)=broad lines. • Lower density (large stars)=narrow lines
Spectroscopic parallax • A star’s spectral type and luminosity combined with info on the HR diagram allow us to estimate a star’s distance from Earth. • Also need inverse-square law. • Accurate to about 10% since HR diagrams consist of broad bands instead of narrow lines. • Let’s look at an example:
We know about radius, luminosity and temperature. What about mass?
Stellar mass • Answer lies in energy source for stars: • Greater mass means higher pressure and temperature at center of stars leading to more rapid fusion and a greater energy output. • To maintain hydrostatic and thermal equilibrium in a more massive star, the star must have a larger radius and higher surface temperature. • This is what we see in the HR diagram.
How do we measure mass? • About half of all visible stars are parts of multiple star systems. • Typically pairs called binary stars. • These stars are gravitationally bound so we can use physics to describe their motions.
Determining stellar masses In principle, if we can determine a and P we can calculate M1+M2. We want M1 and M2 separately however. How do we find that?
Determining stellar masses • Binary stars orbit the center of mass of the system. • Balance point of kids on seesaw. Its position depends on the relative masses of the kids. • Understanding size of orbits around center of mass gives us M1/M2. • This, combined with the sum of the masses (and a little algebra) allows us to calculate the individual masses. • We won’t do this in class today, but you can on the homework for some extra credit.